By Sara Khan · Last updated: August 2026
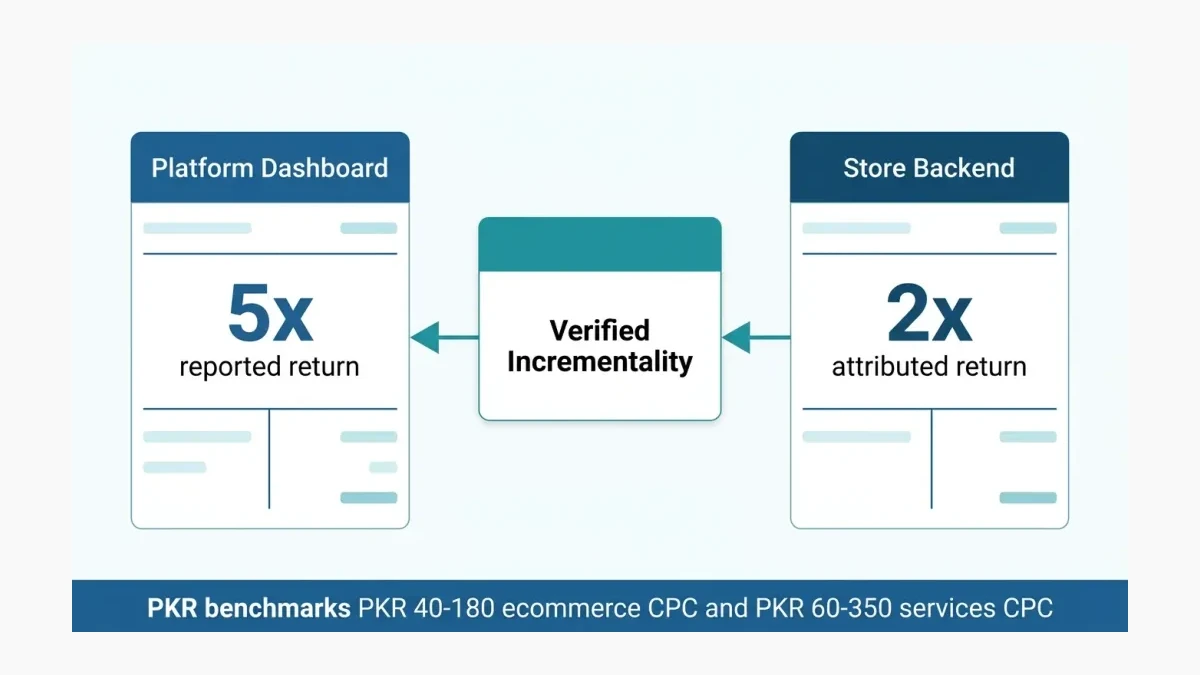
Most Pakistani business owners treat the sales figure inside their Google Ads dashboard as a settled account, the same way a bank statement settles a dispute at the counter. The number deserves less trust than a bank statement, and the evidence has been public for years. A paid-media analysis published by Search Engine Land in August 2026 describes a pattern every scaled advertiser eventually meets: the ad platform reports a 5x return on ad spend, the company’s own backend reports 2x for the same months and the same campaigns, and neither figure describes what actually happened. A Karachi fashion store spending PKR 250,000 a month on Google Ads does not have a reporting problem when it sees those two numbers; it has two partial records of one event, and the owner usually picks whichever one matches the decision already made.
Two ledgers that never matched
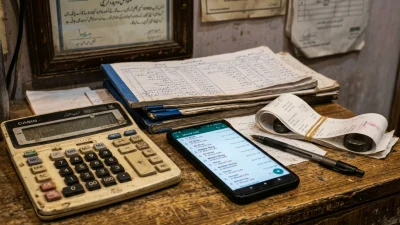
Traders on Hall Road keep a khata for credit and a register for cash, and when the two disagree, the shopkeeper knows at least one book is missing entries. Google Ads reporting works the same way, except the shopkeeper is asked to trust one book written by the person who gets paid by the result. Return on ad spend (ROAS) — revenue attributed to ads divided by what the ads cost — is the headline number in that book, and the platform computes it under rules written in the platform’s favor.
Those rules are generous by design. The Search Engine Land analysis lists what flows into the reported figure: view-through conversions — sales credited to an ad the customer saw but never clicked — plus modeled conversions for users who never consented to tracking, plus conversion windows that still claim a click from three weeks earlier. Every one of those adjustments points upward. A Lahore electronics retailer whose dashboard shows PKR 900,000 of “conversions” in a month is reading a number assembled from confirmed orders, estimated orders, and orders the same customer generated on Meta the same week.
The backend number is not the honest alternative it appears to be. Most Pakistani stores reconcile ad performance against Shopify or Daraz seller reports, which credit the last touch before purchase — usually a brand-name search or a direct visit. The ad that created the demand three weeks earlier gets nothing. Between the platform’s 5x and the backend’s 2x sits the real figure, and almost nobody measures it directly.
The dashboard grades its own homework
The uncomfortable part is structural, not accidental. Advertising platforms are paid as a percentage of what gets spent, and reported performance is what keeps budgets flowing. Search Engine Land puts it plainly:
Marketing platforms grade their own homework and set your spend on the result.
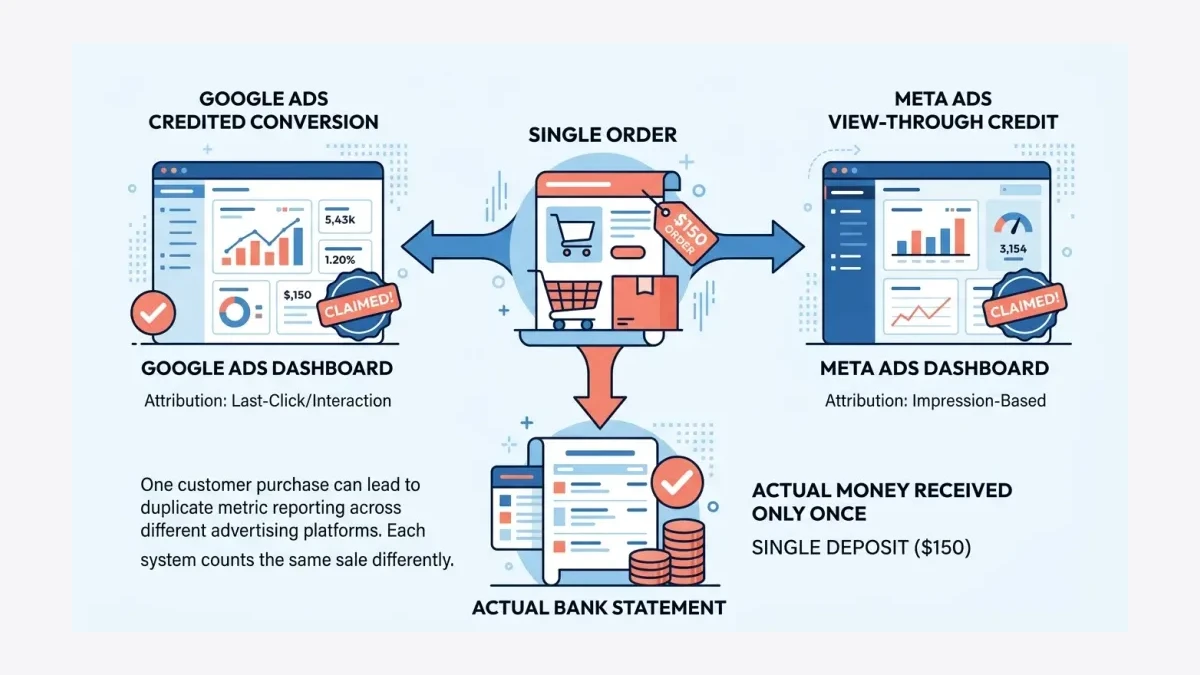
The pattern repeats. Run Google Ads and Meta Ads together, pull each platform’s reported conversion revenue for the same period, add them, and compare the total against actual revenue in your accounts. For most accounts running at scale, the sum exceeds reality, because a customer who saw a Meta ad, later searched the brand, clicked the Google ad, and bought gets booked twice — once by Google for the click, once by Meta for the view. Meta’s view-through window is the single largest source of that overage, according to the same analysis. One sale, two dashboards, zero discounts.
For a Pakistani ecommerce brand, the consequences are concrete. Budget meetings decide between a PKR 300,000 Google allocation and a PKR 150,000 Meta allocation using numbers in which each platform quietly claims the other’s wins. The channel that looks weakest is often the one whose credit keeps being stolen, and the channel that looks strongest is often the one doing the stealing. Cutting the “weak” channel then removes the demand that was feeding the “strong” one, and total sales fall in a way nobody can explain two months later.
Google’s own measurement team effectively conceded the gap in 2026. Attributed Branded Searches — a Google Ads metric that counts people who searched for the advertiser’s brand after seeing an ad — became globally available on June 29, 2026, precisely because last-click reporting could not see demand that ads create upstream of the sale. When the platform selling you the ads builds a metric to expose what its main reporting misses, the default dashboard was never going to be the whole story.
Your own numbers lie in the other direction
Book a free strategy call - we'll audit your current setup and identify the highest-impact fixes.
Backend reporting is not the victim in this arrangement; it is the second liar. Last-click attribution — crediting the final touchpoint before a purchase — answers a narrow question: what did the customer touch last. Owners read it as: what made the customer buy. Those are different questions with different answers.
The blind spot is largest exactly where Pakistani brands spend most freely. Social, display, and video formats work by impression rather than by click, so a customer who scrolls past an Instagram ad, remembers the brand for a week, and then searches its name on Google registers in the backend as an organic or direct sale. To the khata, the impression that created the demand is invisible. After iOS 14 thinned the match between social clicks and purchases, even the clicks that did happen stopped connecting to orders reliably, which made impression-driven channels look emptier still.
Cheap-metric traps compound the distortion. Search Engine Land’s optimization analysis warns that obsessing over the lowest cost per click (CPC) pushes budgets toward unqualified traffic — accidental mobile taps, bot clicks, curiosity searches with no buying intent — while the expensive click on “buy embroidered lawn suit online pakistan” is the one that pays the tailor. A low average CPC with a weak conversion rate — the share of visitors who actually order — is a well-decorated failure.
The benchmarks make the arithmetic plain. WeProms Digital’s aggregated benchmarks for Pakistani SMEs put Google Ads clicks at PKR 40-180 for ecommerce and PKR 60-350 for service businesses, with cost per lead at PKR 800-2,500 for ecommerce stores. LocaliQ’s 2026 search advertising benchmark, covering more than 16,000 campaigns, found an average conversion rate of 8.18% and an average CPC of $5.42 — roughly PKR 1,500 at current rates, an order of magnitude above typical Pakistani auction prices. In plain terms: clicks in Pakistan are cheap, which makes it affordable to accumulate bad data quickly. If a store pays PKR 90 per click and converts 2% of visitors, each order carries PKR 4,500 of media cost before a single rupee of margin, and no dashboard reordering changes that arithmetic.
Why this gets worse before it gets better
Two developments are adding ledgers faster than owners can reconcile them. Google’s AI Mode — which Google says passed one billion monthly users this year — now carries Gemini-built ads assembled from a merchant’s product feed, creating a third reporting surface that claims credit inside conversations rather than clicks. Meanwhile Google is testing channel-level prioritization controls for Performance Max, an admission that even Google’s own automated campaigns distribute budget across Search, YouTube, and Display in ways advertisers could previously neither see nor steer. More surfaces claiming the same sale, adjudicated by algorithms with less and less human visibility.
Globally, the stakes keep rising because the pool keeps deepening: dentsu’s December 2025 forecast projects digital formats will carry 68.7% of total advertising investment in 2026. For a Pakistani SME, that share translates into auction pressure — more local competitors bidding on the same queries each quarter — which makes every misread metric progressively more expensive to keep.
Judge a channel by what disappears when you switch it off
There is one honest question available to any business owner, and it predates every dashboard: what changed because the money was spent. Incrementality — measuring the lift a channel produces versus a comparable situation without it — answers that question directly, typically through a geo split in which Lahore serves the ads and Faisalabad does not, or through periodic holdout weeks. It is slower than reading a dashboard and it is the only reading worth acting on.
Three practices follow from everything above, and none of them require new software. Reconcile platform-reported conversions against bank and courier records monthly, treating the gap as information rather than error. Read branded-search volume, direct traffic, and WhatsApp inquiries as downstream evidence that upper-funnel spend is working, the same signals Google itself now surfaces through Attributed Branded Searches. And refuse to judge any impression-based channel by last-click revenue, because that is the measurement equivalent of asking the register who created the demand.
Consider how the arithmetic works in practice. A Rawalpindi home-services business spending PKR 180,000 a month across Google Search and Meta runs two clean holdout weeks per quarter; if leads fall 15 percent while Meta pauses, Meta’s incremental contribution is measurable and the budget stays; if leads hold steady, the same PKR 90,000 moves to Search, where the owner can watch cost per lead against the PKR 1,000-4,500 service benchmark range instead of trusting either dashboard. The test costs one channel’s momentum for a fortnight; running unmeasured for a year costs considerably more. Google’s Attributed Branded Searches metric supplies the same logic in continuous form — when branded search volume rises during a video campaign, the demand creation is visible even though last-click reporting shows the video channel converting nothing.
The principle underneath all of it is simple and slightly unwelcome: no attribution system tells you what your ads did; each tells you what its rules credit. A business that budgets on a platform’s self-graded number will overfund the loudest dashboard, and a business that budgets on raw last-click will starve the channels that create its future customers. The owner who accepts both distortions, reconciles against the bank, and tests with holdouts is not choosing between 5x and 2x — the choice was never between the two books on the counter.
Read next: Where Pakistani ad budgets quietly leak after the click and The TRACE framework for marketing attribution.
Reconciling platform claims against bank records is exactly where a structured outside review earns its fee. WeProms Digital, Pakistan’s leading Google Ads management agency, has built its measurement practice around incrementality checks rather than dashboard readings, so budgets follow verified revenue, not claimed conversions. If your reported ROAS and your bank statement have never agreed, talk to us or message WhatsApp +92 300 0133399 — we will show you where the gap comes from before you spend another rupee on it.
Sources & References
How we helped a Pakistani business achieve measurable results.
- Search Engine Land — Your paid media ROAS isn’t 5x. Or 2x. — August 25, 2026
- LocaliQ — Search Advertising Benchmarks for Every Industry (2026 data) — 2026
- Search Engine Land — When paid media optimization starts working against you — August 25, 2026
- Search Engine Journal — Why Running YouTube Ads Like Search Will Burn Your Budget — August 26, 2026
- Search Engine Journal — How To Advertise In Google AI Mode For Ecommerce — August 26, 2026
- Search Engine Land — Google tests channel prioritization controls for Performance Max — August 25, 2026
- Google Ads Help — About attribution models — Google official documentation
- WeProms Digital — Marketing benchmarks for Pakistani SMEs — 2026
- dentsu — Ad spend growth is projected to slow to 5% in 2026 — December 2025
Additional reading from industry feeds: