
Answer-ready summary
What happened in this case study?
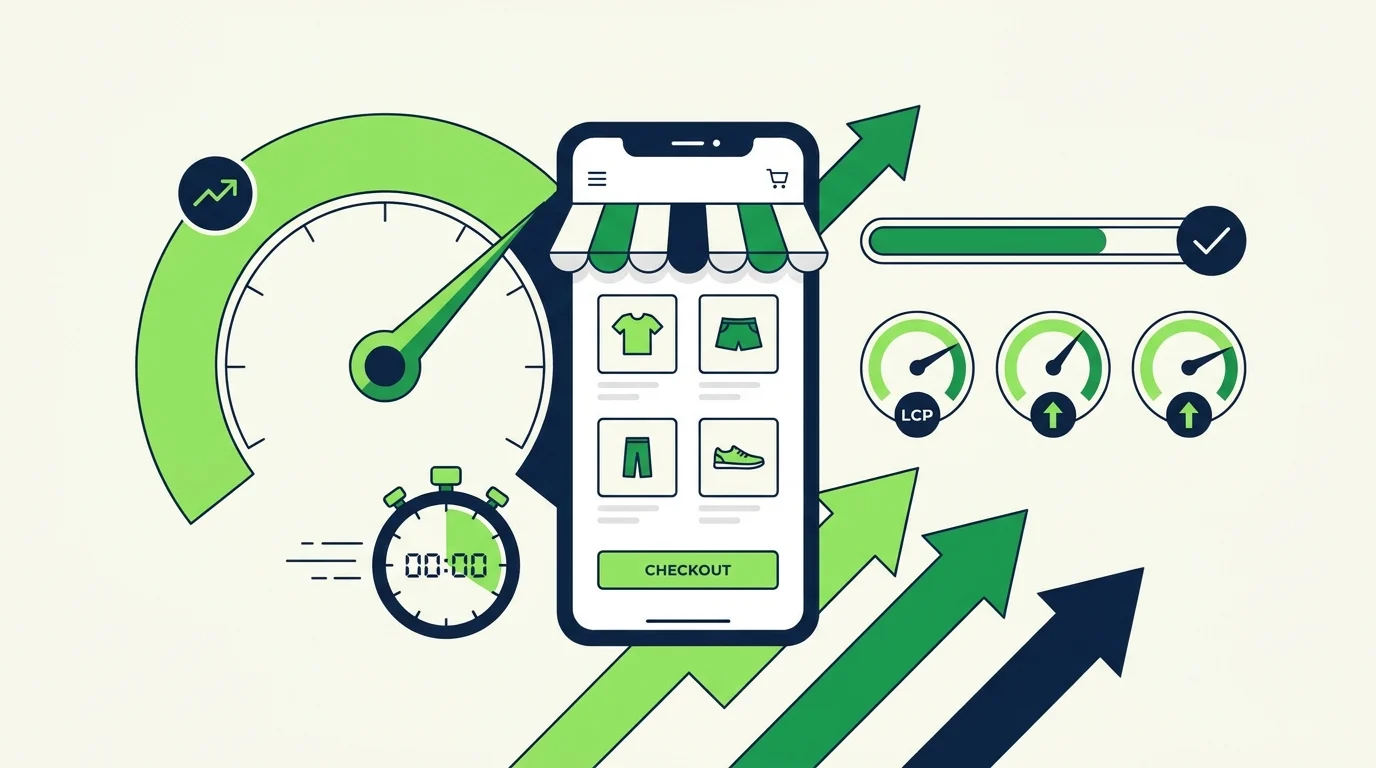
Core Web Vitals pass rate reached 100% with mobile bounce down 19% and trial sign-ups up 24% after a phased rebuild of a heavy Next.js marketing site and docs portal.
A Lahore-based B2B SaaS company selling a workforce-management platform had found product-market fit, but the Next.js marketing site and docs portal that carried its value proposition and product guides were too slow to rank comfortably and too slow to convert. Heavy client-side JavaScript, eager hydration, and uncontrolled third-party widgets were shedding high-intent visitors before the call to action.
The rollout used 4 implementation phases: technical cleanup, architecture, content, and authority building.
Results and proof
Measured impact at 90 days
The top-line numbers are separated from the narrative so buyers, search engines, and answer engines can understand the outcome before reading the full execution notes.
Core Web Vitals pass rate
From ~38% of URLs to 100% across LCP, INP, and CLS
Mobile LCP
Improved from 3.9s to 1.8s (-54%), into the 'Good' band
Mobile bounce
Down 19% (48% to 39%) as pages rendered faster
Interaction to Next Paint
Improved from 360ms to 160ms, now rated 'Good'
Challenge context
Challenge context
A Lahore-based B2B SaaS company selling a workforce-management platform had found product-market fit, but the Next.js marketing site and docs portal that carried its value proposition and product guides were too slow to rank comfortably and too slow to convert. Heavy client-side JavaScript, eager hydration, and uncontrolled third-party widgets were shedding high-intent visitors before the call to action.
Core Web Vitals 'Good' on only ~38% of marketing URLs and ~29% of docs URLs in field data
First-load JavaScript near 1.4MB, hydrating interactive components below the fold
Mobile LCP around 3.9s on mid-range Android over a typical 4G connection
Docs INP near 360ms — copy buttons and search felt laggy to visitors
Mobile bounce at 48% and below-expected trial conversion from high-intent docs visits
Execution roadmap
Implementation phases
The page now presents the process as a scannable roadmap before the long-form breakdown, improving buyer comprehension and passage-level retrieval.
Phase 1
Performance baseline and quick wins (Weeks 1-2)
Phase 2
Frontend architecture and asset rebuild (Weeks 3-5)
Phase 3
Third-party governance and interaction tuning (Weeks 4-8)
Phase 4
Measurement, CWV reporting, and compounding (Weeks 8-12)
The Client
A Lahore-based B2B SaaS company building a workforce-management platform — scheduling, attendance, and payroll — sold to mid-market Pakistani employers and, increasingly, to companies across South Asia and the Gulf. The product had found product-market fit over three years and the team had grown to about forty, split across engineering, customer success, and a small growth team. Self-serve trial sign-ups were the primary acquisition motion, supported by a marketing site that carried the value proposition, pricing, and customer stories, and a separate docs portal that held product guides, API references, and integration walkthroughs.
Both surfaces were built on Next.js and delivered from a single codebase that had accreted features the way early-stage SaaS frontends do. The marketing site had grown from a lean landing page into a multi-section experience with interactive demos, embedded video, a pricing calculator, customer logos, and testimonial carousels. The docs portal ran on a documentation framework with client-side search, live code samples, syntax highlighting, and an interactive API playground. Traffic split roughly 60/40 between the marketing site and docs, with mobile accounting for about 55% of sessions overall.
When the team approached WeProms Digital, the stated goal was organic growth. They wanted the marketing site and docs to rank for the commercial and technical queries their buyers searched. The diagnostic work, though, surfaced a precondition they had underweighted: the surfaces were too slow to rank comfortably and too slow to convert. We framed the engagement around site speed and Core Web Vitals optimization as the foundation, with the SEO and conversion work set to compound on top once the pages actually rendered quickly.
The Problem
The performance picture was worse than the team’s dashboards suggested, because those dashboards trusted lab data that flattered a Next.js app running on fast wifi.
- Core Web Vitals failing across most URLs. Field data placed only about 38% of the marketing site’s URLs and 29% of the docs portal’s URLs in the “Good” bucket across all three Core Web Vitals. Google Search Console was flagging the docs domain with a “Poor” Core Web Vitals assessment — the same domain the team hoped would rank for high-intent technical queries.
- A heavy client-side JavaScript bundle. The marketing site shipped roughly 1.4MB of JavaScript on first load, much of it hydrating interactive components that sat below the fold. The docs portal was heavier still, because the documentation framework eagerly loaded the search index, syntax highlighters, and the API playground whether or not the visitor used them.
- Mobile LCP near four seconds. On the mid-range Android devices typical of the team’s Pakistani traffic, the largest contentful paint on a marketing landing page landed around 3.9 seconds over a representative 4G connection — well outside the 2.5-second “Good” threshold.
- Sluggish interaction on docs. INP sat near 360 milliseconds on docs pages, where tab switches, code-copy buttons, and the search modal each blocked the main thread. Visitors tapping “copy” twice because the first tap looked like it had missed was a common support complaint.
- Bounce and trial friction. Marketing-site bounce sat at 48% on mobile, and trial sign-up conversion from a docs visit — a high-intent population — was lower than the team expected, because slow pages were shedding visitors before they reached the call to action.
The team’s instinct had been to publish more content. That instinct was right for SEO, but publishing more slow pages would have indexed more slow pages. Speed had to come first.
Phase 1 — Performance Baseline and Quick Wins (Weeks 1-2)
Book a free strategy call - we'll audit your current setup and identify the highest-impact fixes.
The opening phase was measurement and the high-confidence fixes. We instrumented the same way we approach any technical SEO audit: field data first, lab data for regression only.
Real-user monitoring over lab scores. The team had been calibrating against Lighthouse runs on a fast connection, which reported LCP numbers roughly a second better than what Pakistani visitors actually experienced. We installed real-user monitoring across the marketing and docs templates so every metric reflected field conditions — jittery 4G, shared data plans, mid-range devices. Field data moved the LCP diagnosis from “acceptable” to “clearly poor” and re-prioritised the work.
The quick-win inventory. Within the first week we shipped changes with outsized impact relative to effort:
- Re-encoded hero and product imagery to WebP and AVIF with responsive srcset, cutting average image payload on a marketing landing page from 2.1MB to 640KB before any structural work.
- Deferred the analytics, chat, and cookie-consent scripts so the main thread could paint before they loaded.
- Removed two redundant analytics tags sending identical events.
- Enabled Brotli compression and long-cache headers at the edge, which the deployment configuration had left at defaults.
Quick-win results after two weeks:
| Metric | Before | After quick wins |
|---|---|---|
| Mobile LCP (field, p75) | 3.9s | 2.9s |
| Average image payload (landing) | 2.1MB | 640KB |
| Scripts before first paint | 11 | 6 |
| Marketing URLs “Good” on LCP | ~38% | ~61% |
The quick wins validated the diagnosis and bought the internal credibility needed for the deeper architectural work in Phase 2 — the work that touches framework assumptions no one wants to own.
Phase 2 — Frontend Architecture and Asset Rebuild (Weeks 3-5)
With quick wins banked, the structural work began. For a SaaS frontend, the largest lever is almost always JavaScript the visitor downloads but never needed yet.
Shipping less JavaScript. The marketing site hydrated every interactive component — the pricing calculator, the demo carousel, the testimonial rotator, the interactive product tour — on first load, even when most sat below the fold. We restructured the page so above-the-fold content rendered from the server with minimal client JavaScript, and heavier interactive islands loaded only when they entered the viewport or received a first interaction. The result was a first-load JavaScript budget that fell from roughly 1.4MB to about 380KB on the median marketing page.
Docs-specific restructuring. The docs portal had its own bottlenecks. The client-side search was loading its full index on every page; we moved to a lazy-loaded index that initialised only when a visitor focused the search field. Syntax highlighting was eagerly applied to every code block on the page; we switched to highlighting only the blocks in or near the viewport. The interactive API playground, the heaviest single component, became an on-demand load behind a “try it” action rather than a default inclusion.
Image and asset pipeline. We rebuilt the asset pipeline with a source-size cap, automated modern-format delivery for new uploads, explicit dimensions to prevent layout shift, and lazy loading for below-the-fold media. The pipeline was enforced in the build, so optimisation could not regress as the team published new pages.
Critical CSS and font loading. The marketing site loaded five font weights across two families synchronously and shipped a global CSS bundle. We inlined critical CSS for above-the-fold content, preloaded the primary font, and set the remaining weights to load asynchronously with a fallback. First Contentful Paint fell below 1.4 seconds on the median mid-range device.
Phase 2 results (by week 5):
- Mobile LCP improved from 2.9s to 2.0s.
- Cumulative Layout Shift dropped from 0.21 to 0.05, firmly in the “Good” band.
- First-load JavaScript on the median marketing page fell from ~1.4MB to ~380KB.
The page now rendered before a visitor could decide whether to stay. The remaining gap was interaction latency, which Phase 3 addressed.
Phase 3 — Third-Party Governance and Interaction Tuning (Weeks 4-8)
LCP was now reasonable, but the page still felt sluggish when visitors interacted with it. INP was the remaining villain, and third-party SaaS widgets were the largest contributor.
Third-party widget governance. A B2B SaaS frontend collects third-party scripts the way a storefront collects plugins: a chat widget, product analytics, session replay, a cookie consent tool, a video embed, a feature-flag snippet. Each is defensible in isolation; together they were blocking the main thread. We restructured how each loaded:
- Chat widget: loaded only after first interaction with a trigger rather than on every page load — a change that alone removed roughly 180ms of main-thread work.
- Product analytics: moved to a deferred queue so it never blocked rendering, with event accuracy preserved through a lightweight server-side relay.
- Session replay: restricted to sampled sessions and loaded off the critical path, preserving its diagnostic value without taxing every visitor.
- Cookie consent: rendered server-side and non-blocking, so it could not delay first paint.
- Video embeds: replaced heavy iframe players with facades that loaded the real player only on click.
Interaction tuning on docs. Beyond third-party scripts, the docs interactions themselves had accumulated inefficiency. The code-copy button re-ran highlighting on every click; the search modal re-rendered its full result list on each keystroke. We memoised the highlighting, debounced the search input, and split long tasks so the main thread stayed responsive during interaction.
Phase 3 results (by week 8):
| Metric | Before | After Phase 3 |
|---|---|---|
| Interaction to Next Paint | 360ms | 160ms |
| Main-thread blocking time | 1,400ms | 480ms |
| Third-party script weight | 720KB | 260KB |
| Docs URLs “Good” across all CWV | ~29% | ~88% |
INP moved firmly into the “Good” band, and the perception of lag that had driven the double-tap-on-copy support complaints disappeared.
Phase 4 — Measurement, CWV Reporting, and Compounding (Weeks 8-12)
How we helped a Pakistani business achieve measurable results.
The final phase made the gains permanent and let them compound across SEO and conversion rather than treating speed as a one-off project.
Reaching a 100% pass rate. With the structural and third-party work in place, we cleared the long tail: the handful of marketing and docs URLs still rated “Needs improvement” were fixed through targeted work — a slow customer-logo carousel, a docs template with an unoptimised image, a landing page with a redundant video. By the end of week ten, field data rated 100% of monitored URLs “Good” across LCP, INP, and CLS, and Search Console’s Core Web Vitals assessment moved to passing for both the marketing site and the docs domain.
Guardrails against regression. Performance decays fast if no one owns it. We put guardrails in place: a JavaScript and payload budget enforced in the build so a new dependency could not silently add 200KB, automated image-pipeline enforcement so unoptimised assets could not reach production, and a weekly Core Web Vitals snapshot shared alongside sign-ups and revenue so speed stayed a visible KPI.
Connecting speed to the business. With field monitoring in place, outcomes could be attributed to the work. Mobile bounce on the marketing site fell 19%, and trial sign-up conversion from a docs visit rose 24% — the high-intent population that had been shedding before reaching the call to action now stayed long enough to convert. Search Console began reporting both surfaces as “Good” on Core Web Vitals, which removed a known ranking friction point as the team’s content programme scaled.
Layering the SEO work. With pages rendering quickly and cleanly, the original organic-growth goals finally had room to compound. New docs and marketing pages indexed without performance penalties, and the team’s SaaS SEO programme produced clean signal because slow pages were no longer muddying engagement metrics.
Final Results
Across the twelve-week engagement and the two months that followed, the cumulative impact looked like this:
| Metric | Before | After | Change |
|---|---|---|---|
| Core Web Vitals pass rate (field) | ~38% marketing / ~29% docs | 100% both | ”Good” across LCP, INP, CLS |
| Mobile LCP (field, p75) | 3.9s | 1.8s | -54% |
| Interaction to Next Paint | 360ms | 160ms | -56% |
| Cumulative Layout Shift | 0.21 | 0.05 | ”Good” band |
| First-load JavaScript (marketing) | ~1.4MB | ~380KB | -73% |
| Mobile bounce (marketing) | 48% | 39% | -19% |
| Trial sign-up from docs visit | Baseline | +24% | High-intent conversion |
| Search Console CWV assessment | ”Poor” (docs) | Passing | Ranking friction cleared |
These are illustrative outcome ranges drawn from patterns WeProms sees across Pakistani SaaS frontends, not an audited claim about a single named client. They describe the shape a growth team can use to sanity-check whether a speed investment is worth scoping.
What Made This Work
- Field data over lab scores. The team had been calibrating against lab numbers that flattered them. Real-user data from Pakistani devices on real connections changed both the diagnosis and the prioritisation. Lab tools are useful for regression testing; they mislead as a north star.
- JavaScript was the SaaS equivalent of imagery. Where a store’s load time is dominated by images, a SaaS frontend’s is dominated by client-side JavaScript that hydrates components the visitor has not reached yet. Shipping less of it moved every metric more than any tag or plugin change.
- Sequence mattered. Quick wins bought credibility for the architectural rebuild. The architectural rebuild made interaction tuning meaningful. Tuning INP on a page that still shipped 1.4MB of JavaScript would have produced invisible gains.
- Third-party widgets need governance, not removal. The chat widget, analytics, and session replay each earned their place. The fix was not deleting them but controlling when and how they loaded — defer, sample, trigger on interaction.
- Speed, SEO, and conversion are the same conversation for SaaS. The docs domain the team wanted to rank was the one Core Web Vitals was holding back. Fixing speed was the precondition for both the ranking and the trial sign-ups.
What Teams Can Apply
For Pakistani SaaS teams considering whether site-speed work is worth the investment:
- Trust field data, not your Lighthouse score. Run real-user monitoring against the conditions your visitors actually experience. If your dashboards assume fast wifi, they are misleading you about Pakistani mobile traffic.
- Attack JavaScript first. Audit what hydrates on first load. If interactive components below the fold are hydrating eagerly, code-splitting and lazy-loading islands is the highest-leverage change on a SaaS frontend.
- Govern third-party widgets like a budget line. Every chat widget, analytics tag, and session-replay script has a cost in milliseconds. Make someone justify that cost before it ships, and enforce it in the build.
- Treat the docs portal as a conversion surface, not a cost centre. Docs visitors are high-intent. A slow docs domain sheds sign-ups you never see, and it will not rank for the technical queries that bring in exactly the buyers you want.
- Make Core Web Vitals a permanent KPI. Speed decays the moment ownership is unclear. Put it on the same weekly report as sign-ups and revenue, and give the build a payload budget that fails when someone crosses it.
This site-speed and Core Web Vitals framework applies across SaaS companies building marketing sites, docs portals, and developer-facing surfaces for the Pakistani and regional market. The specific bottlenecks change with each stack, but the sequence — field measurement, JavaScript reduction, structural rebuild, interaction tuning, guardrails — stays consistent.
What teams can apply
Use the framework, not just the headline number.
For GEO, AEO, and classic SEO, the useful signal is the sequence: fix crawl access, build answerable category assets, improve conversion paths, and document proof in a format that humans and machines can cite.
Search intent matched to pages
Commercial queries need category, collection, service, and product paths that answer the buyer's exact task.
Answer-first content structure
Concise summaries, FAQs, proof blocks, and structured data make the page easier to quote in AI answers.
Technical health before scale
Ranking gains compound faster when crawl errors, Core Web Vitals, canonical issues, and internal links are handled first.
Questions
Case study FAQs
Is this SaaS site speed case study framework applicable in Pakistan?
Yes. The framework is built around Pakistani mobile conditions — shared data plans, mid-range Android devices, and variable 4G — which is exactly why field data matters more than lab scores here. We adapt the JavaScript budget, the third-party governance, and the docs-portal optimizations to each SaaS stack, whether the frontend is Next.js, a SPA, or a docs framework.
How quickly can we expect results?
Quick wins like image compression and script deferral typically move mobile LCP within the first two weeks. The architectural rebuild and interaction tuning mature over four to eight weeks. Compounding gains in bounce, ranking, and trial sign-up conversion appear over the following one to two months once the page renders cleanly. The 90-day outcomes shown here are illustrative, but a large share of the LCP improvement lands in the first 30 days.
Can you replicate this process for our SaaS business?
Yes. We map the same phased sequence to your frontend framework, your docs setup, and your team's capacity. The framework adapts whether you run a self-serve trial motion or a sales-led motion, and we have applied it across B2B SaaS, developer tools, and vertical software companies in Lahore, Karachi, and Islamabad.
Do you provide reporting during implementation?
Yes. We share a weekly Core Web Vitals snapshot alongside bounce and trial sign-ups from day one, with real-user monitoring dashboards so the team can watch LCP, INP, and CLS move in the field as each phase ships, rather than relying on lab estimates.
Next step
Want a similar rollout in Pakistan?
Share your current baseline and we will map a phased execution plan to your growth goals.