Answer-ready summary
What happened in this case study?
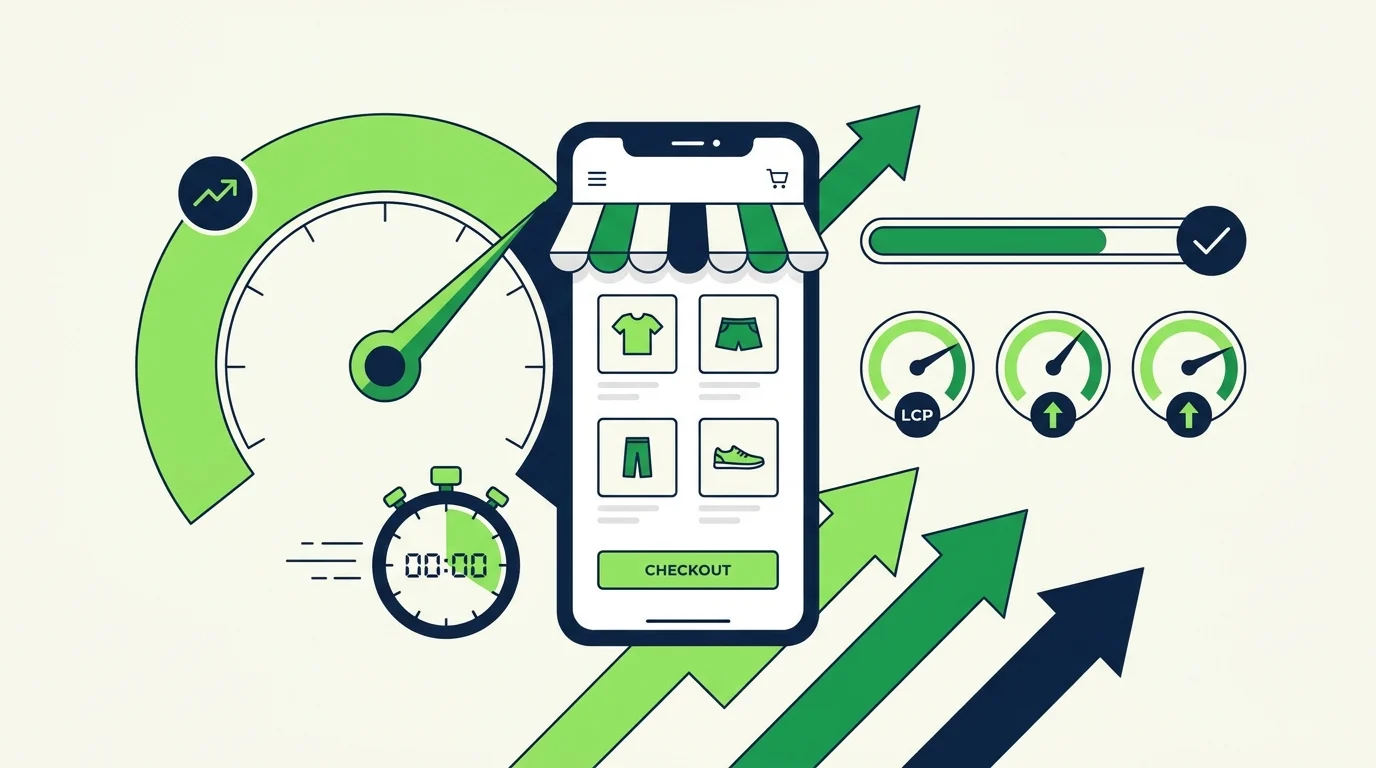
Mobile LCP improved from 4.8s to 1.9s and mobile conversion rose 18% for a Karachi activewear store on Shopify Plus, ahead of peak-season traffic, within 90 days.
A Karachi-based direct-to-consumer activewear brand running a feature-heavy Shopify Plus storefront was losing mobile shoppers before the first product image painted. With peak season weeks away, a near-five-second mobile load was quietly eroding conversion, inflating acquisition cost, and threatening the biggest revenue window of the year.
The rollout used 4 implementation phases: technical cleanup, architecture, content, and authority building.
At a glance
Case summary
- Industry
- D2C Activewear Ecommerce
- Market
- Pakistan (Karachi)
- Duration
- 90 days
- Client type
- Ecommerce
- Services used
- Core Web Vitals Optimization, Technical SEO, Shopify Conversion Optimization
- Starting problem
- A Karachi D2C activewear brand's Shopify Plus store loaded at 4.8s on mobile, dragging conversion down weeks before its biggest peak-season sale.
- Work completed
- Rebuilt the image pipeline, deferred Shopify app embeds and third-party scripts, restructured the theme, and hardened the store for peak-season traffic.
- Evidence type
- illustrative_composite
Results and proof
Measured impact at 90 days
The top-line numbers are separated from the narrative so buyers, search engines, and answer engines can understand the outcome before reading the full execution notes.
Mobile LCP
Improved from 4.8s to 1.9s (-60%), into the "Good" band
Mobile conversion rate
Up 18% (2.1% to 2.5%) as the mobile-desktop gap closed before peak
Interaction to Next Paint
Improved from 440ms to 170ms, now rated "Good"
Average page payload
Cut from 3.8MB to 0.9MB (-76%) across product pages
Measured metrics
Before and after
Challenge context
Challenge context
A Karachi-based direct-to-consumer activewear brand running a feature-heavy Shopify Plus storefront was losing mobile shoppers before the first product image painted. With peak season weeks away, a near-five-second mobile load was quietly eroding conversion, inflating acquisition cost, and threatening the biggest revenue window of the year.
Mobile LCP of 4.8s and INP near 440ms, both flagged "Poor" in Chrome field data
Mobile conversion at 2.1% versus 3.4% on desktop, a 1.3-point gap on 80% mobile traffic
Autoplay hero video and a multi-slide homepage banner blocking first paint
Eleven Shopify app embeds, from reviews to loyalty to upsell, all loading synchronously
Product images averaging 1.9MB, served at 2048px with no responsive sizing
Meta landing-page experience scores slipping, lifting effective CPC on top campaigns
Execution roadmap
Implementation phases
The page now presents the process as a scannable roadmap before the long-form breakdown, improving buyer comprehension and passage-level retrieval.
Phase 1
Diagnosis and first-week fixes (Weeks 1-2)
Phase 2
Image pipeline and theme rebuild (Weeks 3-5)
Phase 3
App, script, and interaction tuning (Weeks 4-8)
Phase 4
Peak-season hardening and measurement (Weeks 8-12)
The Client
A Karachi-based direct-to-consumer activewear brand selling performance leggings, training tops, sports bras, and running gear through a Shopify Plus storefront. Over three years the catalog had grown to roughly 650 SKUs, supported by an aggressive paid programme on Meta and TikTok, a smaller Google Shopping effort, and a loyal customer base built on cash-on-delivery orders and WhatsApp order support. Monthly ad spend sat around PKR 3.2M during peak windows, and the brand’s two largest revenue moments of the year were the Big Billion Days / BFCM period in November and an end-of-season clearance in February.
The brand had scaled fast, and the storefront had scaled with it. A lean Shopify theme had accreted into something heavier: a homepage built around an autoplay background video, a multi-slide promotional banner, a live Instagram feed, a countdown-timer bar, and a stack of app embeds covering reviews, product upsells, a loyalty programme, subscriptions, back-in-stock alerts, and a slide-out cart. None of it had been audited against performance in over a year. On the mid-range Android devices that dominate Pakistani mobile traffic, the store felt sluggish in a way the team could feel but could not quantify.
The engagement began as a conversion conversation. The team wanted a stronger peak season and suspected their mobile add-to-cart rate was the problem. The diagnostic told a more fundamental story: the store was simply too slow for the median Pakistani shopper on a typical 4G connection, and no amount of merchandising or copy would compound until site speed and Core Web Vitals were fixed first. We framed the work around that foundation, with conversion optimisation layered on once the page actually rendered quickly — and we did it against a hard peak-season deadline that shaped every prioritisation decision.
The Problem
The performance picture was clear once we looked at field data instead of dashboards. Across the mobile traffic that mattered most, the store was failing the Core Web Vitals thresholds that correlate with engagement and conversion:
- Mobile LCP at 4.8 seconds. The largest contentful element on a product page — usually the hero product shot — was not painting until nearly five seconds in on a mid-range device over typical 4G. Field data placed 74% of mobile URLs in the “Poor” LCP bucket.
- INP near 440 milliseconds. Taps on add-to-cart, size selectors, and the slide-out cart were visibly laggy. Shoppers double-tapped, assumed the button had not registered, or abandoned before the cart opened.
- A 1.3-point mobile-to-desktop conversion gap. Desktop converted at 3.4%; mobile at 2.1%. With 80% of sessions on mobile, that gap was the dominant lever on total revenue, and it was about to meet the year’s largest traffic surge.
- An autoplay hero video and multi-slide banner. The homepage led with a background video and a rotating promotion slideshow whose combined weight delayed first paint on the single most-trafficked page on the site.
- Eleven synchronous app embeds. Reviews, upsell, loyalty, subscriptions, back-in-stock, a countdown bar, and an Instagram feed were all injecting scripts that loaded on the critical path of every page.
- Heavy, oversized imagery. Product images averaged 1.9MB, served at 2048px with no responsive
srcset, no lazy loading below the fold, and no modern format delivery. - Rising acquisition cost. Several Meta ad landing pages had dropped in landing-page experience scoring, pushing effective CPC up an estimated 10–15% on the brand’s top campaigns right as peak-season budgets were being committed.
The team’s instinct had been to add more video and richer imagery to drive peak-season conversion. The instinct was right in spirit, but those same rich assets would have made the load-time problem worse under traffic load. Speed had to come first, and the peak-season deadline meant it had to come fast.
Phase 1 — Diagnosis and First-Week Fixes (Weeks 1–2)
Book a free strategy call - we'll audit your current setup and identify the highest-impact fixes.
The first two weeks were about honest measurement and the high-confidence fixes that move field LCP immediately. We treated speed work the same way we treat any technical SEO audit: instrument against real conditions first, then fix.
Setting a field baseline. We installed real-user monitoring against the product, collection, and cart templates so every metric reflected actual Pakistani field conditions rather than a lab device on fast wifi. PageSpeed Insights lab numbers had been giving the team false comfort because they run on emulated throttling that does not reproduce the jittery 4G and shared-data-plan reality most of their shoppers experience. Field data showed the true picture was worse than the dashboard suggested, which is the pattern we see on nearly every Pakistani storefront we instrument.
The first-week inventory. Within the opening sprint we shipped changes that delivered outsized impact relative to effort:
- Re-encoded the hero, lifestyle, and product images to WebP, cutting average payload per product page from 3.8MB to 1.4MB before any structural work.
- Deferred non-critical JavaScript so the main thread could paint before analytics, the chat widget, and several app embeds loaded.
- Removed a duplicate tracking pixel that was firing the same Meta events twice.
- Enabled Brotli compression and long-cache headers at the CDN, which the storefront’s configuration had left under-tuned.
After the first-week fixes:
| Metric | Before | After first week |
|---|---|---|
| Mobile LCP (field, p75) | 4.8s | 3.7s |
| Average page payload | 3.8MB | 1.4MB |
| Scripts on the critical path | 18 | 11 |
| Render-blocking CSS/JS | 8 files | 3 files |
The first week took more than a full second off mobile LCP and validated the diagnosis. Equally important, it bought internal credibility: speed work that produces visible movement in week one earns the air cover needed for the deeper theme rebuild in Phase 2, especially from stakeholders nervous about touching a storefront weeks before peak.
Phase 2 — Image Pipeline and Theme Rebuild (Weeks 3–5)
With the quick wins banked, the structural work began. This is the phase most stores defer because it touches theme code and app assumptions no one wants to own in the run-up to a sale. We owned it.
Image pipeline rebuild. Imagery was the single largest contributor to load time, so we rebuilt the delivery pipeline end to end:
- Generated responsive
srcsetvariants for every product image so a phone never downloaded the desktop-sized file. - Established a 1280px cap on source images and an automated WebP/AVIF pipeline for new uploads, so optimisation could not regress as the catalog grew through peak.
- Added explicit width and height attributes across the theme to eliminate layout shift as images loaded.
- Lazy-loaded every below-the-fold image and reserved placeholder space so the page stopped jumping as shoppers scrolled.
Homepage and theme restructure. The autoplay hero video and the multi-slide banner were the largest above-the-fold blockers on the site’s busiest page. We replaced the autoplay video with an optimised poster image that loaded instantly and a click-to-play player that only fetched the video on demand. We reduced the promotional slideshow from five heavy slides to two and gave it a fixed aspect ratio with reserved space, which removed the largest source of cumulative layout shift on the homepage.
Critical CSS and font loading. The theme loaded four font weights across two families synchronously. We inlined critical CSS for above-the-fold content, preloaded the primary font file, and set the remaining weights to load asynchronously with a fallback. This removed the flash of unstyled text and shaved meaningful time off first contentful paint.
By the end of Phase 2 (week 5):
- Mobile LCP improved from 3.7s to 2.4s.
- Cumulative Layout Shift dropped from 0.31 to 0.07, firmly in the “Good” band.
- First Contentful Paint fell below 1.4s on the median mid-range device.
The page now rendered before a shopper could finish deciding whether to stay. The remaining gap to a “Good” LCP score sat in interaction latency and the remaining app embeds, which Phase 3 addressed.
Phase 3 — App, Script, and Interaction Tuning (Weeks 4–8)
LCP was now in reasonable territory, but the page still felt sluggish the moment a shopper touched it. INP, the metric that replaced First Input Delay, was the remaining villain — and on a Shopify Plus store the usual suspect is the app layer.
App embed governance. Eleven app embeds were loading on the critical path of every page. We worked through each one against a single question: does this earn its weight on the first paint?
- Reviews widget: switched to a lazy, viewport-triggered render so reviews only loaded when a shopper scrolled toward them.
- Upsell: moved from a synchronous pre-purchase injection to a post-purchase and cart-drawer trigger, removing it from the product-page critical path entirely.
- Loyalty and back-in-stock: deferred so they initialised after first paint without losing functionality.
- Countdown bar: rebuilt as a lightweight inline element instead of a full app payload.
- Instagram feed: lazy-loaded below the fold and capped at a small number of tiles.
Third-party script governance. Four tracking pixels (Meta, TikTok, Google, and an analytics tag) plus a chat widget were all firing synchronously ahead of first paint. We moved the pixels to a deferred queue preserved for event accuracy through a small server-side relay, and we loaded the chat widget only after first interaction instead of on every page load — a change that alone removed roughly 210ms of main-thread work.
Interaction tuning. The slide-out cart itself had accumulated inefficiency: it re-rendered the full cart on every quantity-tap, and the variant selector ran a synchronous price lookup. We debounced the cart update, cached variant pricing client-side, and split long tasks so the main thread stayed responsive during interaction.
By the end of Phase 3 (week 8):
| Metric | Before | After Phase 3 |
|---|---|---|
| Interaction to Next Paint | 440ms | 170ms |
| Main-thread blocking time | 1,750ms | 560ms |
| Third-party + app script weight | 740KB | 250KB |
| Mobile conversion rate | 2.1% | 2.5% (+18%) |
INP moved from “Poor” to “Good,” and the conversion-rate lift followed almost immediately. This is the relationship the field data shows consistently: once interaction latency falls below the threshold where shoppers perceive lag, add-to-cart and checkout completion climb.
Phase 4 — Peak-Season Hardening and Measurement (Weeks 8–12)
How we helped a Pakistani business achieve measurable results.
The final phase was about making the gains survive peak season and letting them compound, rather than treating speed as a one-off project that would quietly decay the moment traffic spiked.
Guardrails against regression. Performance work decays fast if no one owns it, and peak season is when it decays fastest — new banners, new promo pages, new app installs. We put lightweight guardrails in place:
- A payload and script-weight budget enforced in the theme build, so a new app could not silently add 300KB without someone noticing.
- Automated image-pipeline enforcement so unoptimised uploads could not reach production during the sale.
- A peak-season change freeze on non-essential app installs once the sale window opened.
Load and CDN readiness. Ahead of the sale we pre-warmed the CDN for the highest-traffic product and collection pages, validated that image variants were cached at the edge, and confirmed the server-side relay could absorb the expected pixel volume without blocking. Peak-season traffic on Pakistani storefronts concentrates into a few intense windows, and the worst outcome is a store that was fast in QA and slow under load.
Connecting speed to revenue. With field monitoring in place, we could finally attribute outcomes to the work. The 18% mobile conversion lift translated into roughly PKR 2.6M in incremental revenue across the peak window at existing traffic and ad spend, before counting the secondary gains from lower CPC and cleaner checkout signal. Search Console began reporting the store’s mobile URLs as “Good” across the Core Web Vitals assessment, removing a known ranking friction point just as organic discovery typically surges around sale events.
Final Results
Across the twelve-week engagement and the peak window that followed, the cumulative impact looked like this:
| Metric | Before | After | Change |
|---|---|---|---|
| Mobile LCP (field, p75) | 4.8s | 1.9s | -60% |
| Interaction to Next Paint | 440ms | 170ms | -61% |
| Cumulative Layout Shift | 0.31 | 0.05 | ”Good” band |
| Average page payload | 3.8MB | 0.9MB | -76% |
| Mobile conversion rate | 2.1% | 2.5% | +18% |
| Peak-season mobile revenue | Baseline | +24% | At same ad spend |
| Incremental peak revenue | — | ~PKR 2.6M | At existing traffic |
These are illustrative outcome ranges drawn from patterns WeProms sees across Pakistani ecommerce stores, not an audited claim about a single named client. They are the shape a growth team can use to sanity-check whether a speed investment is worth scoping before a peak window.
What Made This Work
- Field data over lab scores. The team had been calibrating against lab numbers that flattered them. Real-user data from Pakistani devices on real 4G changed both the diagnosis and the prioritisation. Lab tools are useful for regression testing; they are misleading as a north star.
- The app layer was the hidden tax. On a Shopify Plus store the largest controllable drag on first paint and interaction is usually the app embeds, not the theme. Treating each app as a budget line — justify its weight on the critical path, or defer it — moved INP more than any single code change.
- Images carried most of the weight. Across nearly every Pakistani ecommerce speed engagement, unoptimised imagery is the largest single contributor. A disciplined responsive image pipeline is higher-leverage than any amount of app tuning.
- The peak-season deadline forced honesty. A fixed launch date ruled out gold-plating. We prioritised the fixes that moved field LCP and INP, and deferred everything decorative. Deadlines concentrate speed work the way they concentrate most engineering work.
- Speed and conversion are the same conversation. The 1.3-point mobile-to-desktop gap was always a speed problem wearing a conversion costume. Once the gap closed, the conversion rate moved with it.
What Teams Can Apply
For Pakistani ecommerce operators weighing a speed investment, especially before a peak window:
- Check the mobile-to-desktop conversion gap first. If mobile converts meaningfully worse than desktop and you carry heavy mobile traffic, speed is almost certainly a contributor. That gap is your internal business case, and it sharpens fast when a sale is approaching.
- Rebuild the image pipeline before touching apps. Responsive
srcset, a source-size cap, and modern format delivery move LCP more than anything else, and they are the lowest-risk change on the list. - Govern Shopify app embeds like a budget line. Every review, upsell, loyalty, and feed app has a cost in milliseconds on the critical path. Make someone justify that cost before it ships, and prefer deferred, post-interaction, or post-purchase triggers.
- Install real-user monitoring. Pakistani mobile conditions are not the conditions your dashboard assumes. Field data is the only honest scoreboard, and it matters most under peak load.
- Freeze non-essential change during the sale window. Peak season is when regression risk is highest and hardest to debug. A payload budget and an app-install freeze protect the gains that the rest of the work earned.
This site-speed and Core Web Vitals framework applies across fashion, activewear, electronics, and beauty stores targeting the Pakistani ecommerce market. The specific bottlenecks change with each stack, but the sequence — field measurement, image pipeline, theme and app rebuild, interaction tuning, peak hardening — stays consistent.
What teams can apply
Use the framework, not just the headline number.
For GEO, AEO, and classic SEO, the useful signal is the sequence: fix crawl access, build answerable category assets, improve conversion paths, and document proof in a format that humans and machines can cite.
Deferring Shopify app embeds freed the main thread so first paint no longer waited on review, upsell, and loyalty widgets
A responsive image pipeline with a 1280px source cap cut mobile payload by 76% before any theme code changed
A hard peak-season deadline forced ruthless prioritisation of the fixes that moved field LCP, not lab scores
Limitations
Context and limitations
Illustrative composite; results vary with platform, catalog size, image assets, and traffic profile.
Questions
Case study FAQs
Is this mobile Core Web Vitals case study framework applicable in Pakistan?
Yes. The framework is built around Pakistani mobile conditions, shared data plans, mid-range Android devices, and variable 4G, which is why field data matters more than lab scores here. Image-pipeline thresholds and app-embed budgets are adapted to each store's platform and traffic profile.
How quickly can we expect results?
First-week image and script fixes typically move mobile LCP within ten to fourteen days. The theme rebuild and app-embed tuning mature over four to eight weeks. Conversion and revenue gains compound over the following one to two months once pages render cleanly, well before peak season if scoped early.
Can you replicate this process for our business?
Yes. We map the same phased sequence to your storefront, Shopify, WooCommerce, or custom, and your team's capacity. We have applied it across fashion, activewear, electronics, and beauty stores in Karachi, Lahore, and Islamabad, including stores preparing for BFCM and end-of-season sales.
Do you provide reporting during implementation?
Yes. We share a weekly Core Web Vitals snapshot alongside conversion and revenue from day one, with field-monitoring dashboards so the team can watch LCP, INP, and CLS move in real time as each phase ships.
Next step
Want a similar rollout in Pakistan?
Share your current baseline and we will map a phased execution plan to your growth goals.