
Answer-ready summary
What happened in this case study?
Verified remarketing ROAS rebuilt from roughly 2.8x to 4.8x in 90 days while cart recovery climbed from 11% to 19% and the average discount per recovered order fell 63%.
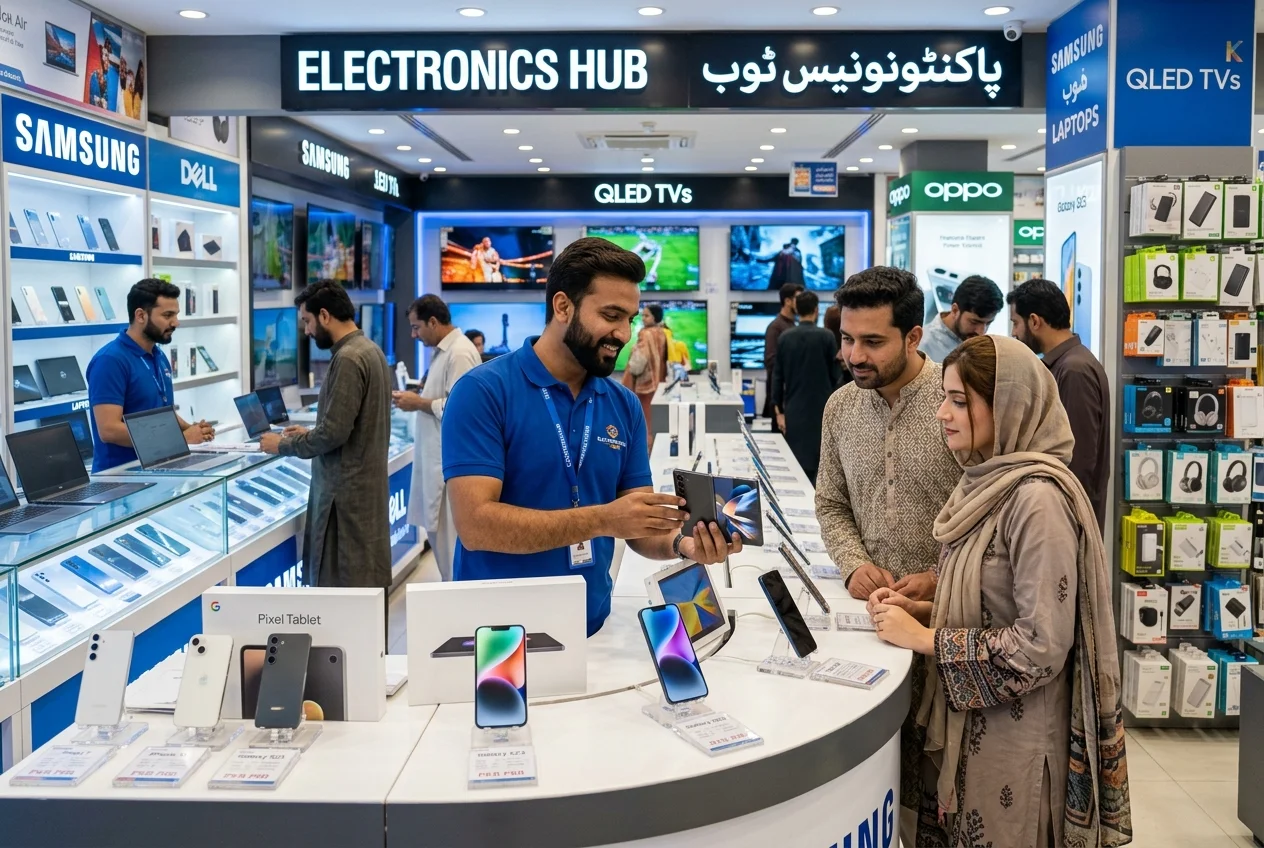
A family-owned, multi-brand electronics retailer in Rawalpindi selling laptops, smartphones, and gaming gear through a WooCommerce storefront was spending about PKR 3.1M a month on paid media. Its retargeting layer looked like the best-performing part of the account at 5.9x reported ROAS — until a margin review showed that seven in ten recovered carts carried an automatic 10% coupon that consumed most of an 8-18% hardware gross margin. The channel was recovering carts by teaching customers to abandon.
The rollout ran in 4 phases: Coupon leakage audit and measurement cleanup; Audience tiers and offer ladder build; Creative sequencing and bid tuning; Incrementality checks and scaling.
At a glance
Case summary
- Industry
- Consumer electronics ecommerce
- Market
- Pakistan (Rawalpindi)
- Duration
- 90 days
- Client type
- Ecommerce
- Services used
- Retargeting and remarketing systems, Abandoned cart and browse recovery, Coupon code leak audit and recovery
- Starting problem
- An electronics retailer's retargeting reported 5.9x ROAS while recovering carts almost entirely through an automatic 10% coupon that consumed most of an 8-18% hardware gross margin, training customers to abandon before buying.
- Work completed
- Rebuilt retargeting into intent-tiered Meta and Google audiences with a margin-aware offer ladder, last-resort-only coupons, purchaser suppression, cross-platform frequency governance, and deduplicated, holdout-checked measurement.
- Evidence type
- illustrative_composite
Results and proof
Measured impact at 90 days
Headline outcomes first — where a metric moved from a measured starting point, both ends of the change are shown before the full execution notes.
Verified remarketing ROAS
Roughly 2.8x to 4.8x (platform-reported figure fell from 5.9x)
Abandoned carts recovered
11% to 19% of monthly abandoned carts
Cost per recovered order
PKR 2,170 to PKR 1,260 (-42%)
Average discount per recovered order
PKR 3,000 to PKR 1,100 (-63%)
Measured metrics
Before and after
Challenge context
Challenge context
A family-owned, multi-brand electronics retailer in Rawalpindi selling laptops, smartphones, and gaming gear through a WooCommerce storefront was spending about PKR 3.1M a month on paid media. Its retargeting layer looked like the best-performing part of the account at 5.9x reported ROAS — until a margin review showed that seven in ten recovered carts carried an automatic 10% coupon that consumed most of an 8-18% hardware gross margin. The channel was recovering carts by teaching customers to abandon.
~PKR 620K/month retargeting spend reporting 5.9x ROAS, but 72% of recovered orders used an auto-applied 10% coupon
Blended hardware gross margin of 8-14% on phones and 12-18% on laptops — a 10% coupon erased most of it
Cart abandonment near 76% with only ~11% of abandoned carts recovered by the paid layer
Meta and Google both retargeting the same users; combined frequency above 14 impressions a week
Purchasers not excluded for 30 days — buyers retargeted with the laptop they had just received
Platform-reported ROAS double-counting across Meta and Google with no deduplication or holdout checks
Execution roadmap
Implementation phases
Delivered in 4 phases, in the order they ran, with each phase building on the outputs of the one before it.
Phase 1
Coupon leakage audit and measurement cleanup (Weeks 1-2)
Phase 2
Audience tiers and offer ladder build (Weeks 3-5)
Phase 3
Creative sequencing and bid tuning (Weeks 4-8)
Phase 4
Incrementality checks and scaling (Weeks 8-12)
The Client
The business in this engagement is a family-owned, multi-brand electronics retailer in Rawalpindi — a retail counter near Commercial Market backed by a WooCommerce storefront carrying roughly 900 SKUs of laptops, smartphones, gaming accessories, and smart-home gear. The online store turned over about PKR 18M a month at an average order value near PKR 43,000, which puts every order firmly in considered-purchase territory: almost nobody buys a PKR 180,000 laptop on a first visit, and around 85% of orders complete as cash on delivery.
Paid media took about PKR 3.1M a month, split across Meta (an Advantage+ Shopping campaign plus a retargeting layer) and Google (Shopping, Demand Gen, and brand search). Roughly PKR 620K of that — a fifth of the budget — went to retargeting, and on the platform dashboards it looked like the most efficient spend in the account: 5.9x reported ROAS, healthy conversion volume, a channel the family considered settled.
The engagement began over a different question than ROAS. The owner’s accountant had noticed that gross profit per online order had been drifting down for two quarters even as revenue held up, and asked us to find out where the margin was going. The trail led to the retargeting layer. The store’s recovery mechanism of choice was an automatic 10% “complete your purchase” coupon, applied the moment a cart crossed 24 hours old. On hardware margins of 8–14% for phones and 12–18% for laptops, a 10% coupon hands back most of the gross profit on the order. And because the coupon was predictable, customers had learned the pattern: put the laptop in the cart, wait a day, buy it cheaper. The channel reported 5.9x ROAS while quietly training the customer base to abandon. The client is described here in anonymized terms, and the figures that follow are illustrative outcome ranges drawn from patterns WeProms sees across Pakistani catalogue retail.
The Problem
Opening the account and the order data revealed four compounding issues:
- Discount-led recovery was eating the margin it claimed to win. Seventy-two percent of recovered carts carried the automatic coupon, at an average give-back of roughly PKR 3,000 per recovered order — against a blended gross margin of about PKR 5,000 on a PKR 43,000 basket. After the coupon, delivery costs, and COD failure handling, contribution per recovered order was thin to negative. Roughly PKR 440K a month was going out the door as coupon value, much of it to buyers who would have completed anyway.
- The retargeting audience ignored the consideration cycle. A single “all visitors, 30 days” audience treated a buyer comparing laptops over three weeks identically to someone who glanced at a phone cover for four seconds. Laptop buyers in Pakistan typically research for 14–30 days across Daraz, brand stores, and retailer sites; the audience window and the buying cycle had nothing to do with each other.
- Meta and Google were retargeting the same people on top of each other. Both platforms ran recovery campaigns against the same visitor pool with no shared suppression, so a cart abandoner could see fourteen or more combined impressions a week — the Meta dynamic ad and the Google Display banner for the same laptop. Frequency at that level stops persuading and starts irritating, and CPMs on the fatigued audiences drifted upward all quarter.
- Purchasers were never excluded. Buyers kept seeing the product they had just bought for up to 30 days after delivery — pure waste, and worse, a missed warranty-and-accessory attach opportunity on the one audience with proven intent.
Underneath all of it sat a measurement problem: the 5.9x figure was platform-reported, double-counted across Meta and Google, and uncorrected for buyers who would have returned on their own. Nobody could say what retargeting was actually adding, which is why a margin-destroying mechanic had survived for two quarters on the strength of a dashboard number. Cart abandonment sat near 76% — normal for COD electronics — with only about 11% of abandoned carts recovered by the paid layer at meaningful cost.
Phase 1 — Coupon Leakage Audit and Measurement Cleanup (Weeks 1-2)
Book a free strategy call - we'll audit your current setup and identify the highest-impact fixes.
The first two weeks answered two questions with numbers rather than dashboards: what was the coupon actually costing, and what was retargeting actually adding?
The coupon audit. We reconciled twelve months of order data against coupon redemptions, segmenting every recovered cart by coupon status, category, and margin band. The findings set the agenda for the whole engagement: coupon-carrying recovered orders contributed close to nothing after give-back and fulfilment costs; repeat customers redeemed at nearly twice the rate of first-time buyers (the clearest possible sign of trained behaviour); and a meaningful share of “recovered” orders showed session patterns consistent with buyers who had simply waited for the coupon to arrive rather than being won back by an ad. This is the same class of work as a coupon code leak audit and recovery review: quantify the give-back first, then decide what the recovery mechanism should be.
Measurement cleanup. Before trusting any ROAS figure, the tracking was rebuilt: Meta Pixel and Conversions API events were deduplicated by event ID so each purchase counted once; Google Ads conversion values were rebuilt from actual order value including coupon deductions, so “revenue” stopped meaning “revenue before discount”; and a weekly reconciliation sheet compared platform-reported conversions against actual WooCommerce orders. Reported revenue across both platforms had been overstating delivered contribution significantly — the double-counted, pre-coupon view.
The baseline lock. With reconciled data, the honest baseline emerged: verified remarketing ROAS nearer 2.8x than the reported 5.9x, cart recovery at 11%, cost per recovered order of about PKR 2,170 on the cart-tier spend, and average discount per recovered order of roughly PKR 3,000. That lock is what every later number is measured against.
| Audit finding | Reported view | Reconciled view |
|---|---|---|
| Remarketing ROAS | 5.9x | ~2.8x after dedup and double-count removal |
| Monthly coupon cost | Not tracked | ~PKR 440K, 72% attach on recovered orders |
| Contribution per recovered order | Assumed healthy | Near zero on coupon-carrying orders |
| Combined weekly frequency | ~6x per platform view | 14+ impressions across Meta and Google |
| Purchaser exclusion | None | Buyers retargeted up to 30 days post-delivery |
Phase 2 — Audience Tiers and Offer Ladder Build (Weeks 3-5)
Phase 2 rebuilt the retargeting layer around two ideas: match audience windows to how electronics are actually bought, and price the discount as a last resort rather than a default. This is the structural core of a modern retargeting and remarketing systems build — the platforms matter less than the logic layered on top of them.
Temperature tiers with cycle-matched windows. The single blob audience became five tiers, each with its own window, budget, and creative: product viewers (14 days, the outer edge of the laptop research window), engaged viewers who spent over a minute on a product page or compared two models (7 days), cart abandoners (7 days), checkout abandoners (3 days — the shortest window on a short decision), and recent purchasers (45 days, used for warranty and accessory attach rather than recovery). Meta carried dynamic product ads against the catalogue; Google Demand Gen and Dynamic Remarketing carried the same tiers on Google-owned surfaces, with the purchaser list synced to both platforms for suppression within hours of delivery.
The offer ladder. Instead of one blunt coupon, each tier received the cheapest incentive that converts it, and the discount moved to the bottom rung:
| Tier | Before (auto 10% coupon) | After (offer ladder) |
|---|---|---|
| Product viewers | Same coupon as everyone | Dynamic ad: price, genuine warranty, COD, delivery ETA |
| Engaged viewers | Same coupon | Comparison creative + bundle nudge (bag, mouse, extended warranty) |
| Cart abandoners | 10% coupon at 24 hours | Cart reminder with COD and delivery ETA; no coupon |
| Checkout abandoners | 10% coupon | Single-use 5% coupon capped at PKR 3,000, 72-hour expiry |
| Recent purchasers | Retargeted with bought product | Warranty upgrade and accessory attach offers |
The coupon did not disappear — it became a precision tool. A single-use code, half the old size, capped in absolute rupees, valid for 72 hours, and shown only to people who had entered checkout and stepped away: the tier whose objection is last-mile hesitation rather than price discovery.
Frequency governance across platforms. Weekly caps were set per tier (tightest on viewers, a short sharp burst on checkout abandoners whose decision window closes fast), and the Meta and Google layers shared suppression lists so the two platforms stopped stacking impressions on the same user. Combined frequency fell from fourteen-plus to around four a week without any loss in reach that mattered.
Dayparting. Pakistani browsing — and COD order placement — peaks in the evening. Delivery of the recovery ads was weighted toward the 8pm–1am window, when the buyer who abandoned a cart at lunch was actually back on their phone comparing prices again.
Phase 3 — Creative Sequencing and Bid Tuning (Weeks 4-8)
Structure decides who sees what; creative decides whether they come back. Weeks four through eight built a sequencing system so that a returning user met a coherent story rather than one repeated banner.
Sequencing by temperature. Viewers saw spec-led dynamic creative (the exact laptop, price, warranty status). Engaged viewers saw comparison creative acknowledging the shortlist (“still deciding between these two?”) with a bundle nudge. Cart abandoners saw trust-led creative — genuine warranty, cash on delivery, a named delivery window — because the recordings of recovered journeys showed the hesitation at this tier was payment and authenticity risk, not price. Checkout abandoners alone saw the last-resort coupon. Creative refreshed on a ten-to-fourteen-day cycle, with each batch built from the previous cycle’s winners, in both English and Urdu variants; Urdu trust-led variants consistently outperformed English on the cart tier in Rawalpindi and the surrounding metros.
The discount test that settled the argument. The store’s management expected recovery to collapse once the blanket coupon was withdrawn. It fell — from 11% to about 16% — while contribution per recovered order nearly doubled, because the recovered orders arrived at full margin. Adding the last-resort coupon on checkout abandoners and the bundle nudges pushed recovery to 19% by week eight, comfortably above the old baseline, with only 31% of recovered orders carrying any discount at all. Total monthly coupon outlay fell from roughly PKR 440K to about PKR 285K even as monthly recovered orders rose by more than seventy percent.
Bid tuning on clean data. With deduplicated conversion values feeding the platforms, the cart and checkout tiers moved to value-based bidding once each cleared enough conversions; the viewer tier stayed on cost caps as the least efficient edge of the funnel. Evening-weighted budgets followed the dayparting data. The purchaser cross-sell tier — previously wasted spend showing buyers their own purchase — became a small but genuinely profitable warranty-attach engine at around 3.6x ROAS.
Phase 4 — Incrementality Checks and Scaling (Weeks 8-12)
How we helped a Pakistani business achieve measurable results.
The final phase proved the numbers were real and set the rules that keep them real.
The holdout. Retargeting is the channel most skilled at claiming credit for orders that would have arrived anyway — especially where, as here, some buyers had learned to wait for a coupon. We ran a two-week audience holdout, splitting the retargeting-eligible pool and suppressing ads to a control slice. The verified lift over the holdout is what justified the headline 4.8x figure; the platform-reported number, even after cleanup, still runs hotter than the holdout-verified view, and the team now knows the size of that gap rather than arguing about it.
Coupon governance. The auto-coupon was formally retired, replaced by a written policy: discounts on recovery only at the checkout tier, single-use, capped, time-boxed, and reviewed monthly against contribution per recovered order. Coupon cost per recovered order joined the dashboard as a standing metric, so leakage can never again accumulate invisibly behind a healthy-looking ROAS.
Scaling the additive tiers. Budget followed the verified numbers: the checkout and cart tiers and the purchaser attach engine scaled up, the viewer tier was held at a cost-capped ratchet, and the quarterly plan moved spend from prospecting blur toward the tiers the holdout proved additive. The blended account ROAS rose from 2.4x to 2.9x at flat total spend — the clearest single sign that the retargeting rebuild pulled the rest of the account up with it, because the optimizers were finally learning from clean, value-accurate data.
Final Results
Measured against the Phase 1 baseline lock at the 90-day mark:
| Metric | Baseline | 90 days | Change |
|---|---|---|---|
| Verified remarketing ROAS | ~2.8x (5.9x reported) | 4.8x | +71% verified |
| Abandoned carts recovered | 11% | 19% | +8 pts |
| Cost per recovered order | PKR 2,170 | PKR 1,260 | -42% |
| Average discount per recovered order | PKR 3,000 | PKR 1,100 | -63% |
| Coupon-carrying share of recovered orders | 72% | 31% | -41 pts |
| Contribution per recovered order | Index 100 | ~192 | Nearly doubled |
| Combined weekly frequency | 14+ | ~4 | Fatigue eliminated |
| Blended account ROAS | 2.4x | 2.9x | +21% at flat spend |
The headline reversal is worth stating plainly: the platform-reported ROAS fell from 5.9x to the low fives, and the business got materially more profitable. The old number was inflated by double-counting and by coupon-driven orders that margin analysis showed were barely contributing. The verified figure — deduplicated, holdout-checked, measured after discount — nearly doubled the true efficiency of the layer. Any Pakistani retailer reading a retargeting dashboard should note which of those two numbers their decisions currently run on; more context on this pattern sits in our overview of marketing for electronics stores in Pakistan.
What Made This Work
-
The margin layer was added to the ROAS conversation. Platform dashboards report revenue before discount and after double-counting. Once recovered orders were evaluated on contribution — coupon, delivery, and COD failure included — the “best-performing” part of the account was exposed as the least profitable. No bidding change could have fixed that; only the offer could.
-
The discount was repositioned, not abolished. A single-use, capped, 72-hour coupon reserved for checkout abandoners preserved most of the recovery power at a fraction of the give-back. The lesson is precision: the same rupee of incentive buys far more conversion at the checkout tier than at the viewer tier.
-
Audience windows were matched to the real buying cycle. Laptops in Pakistan are bought on a 14–30 day research arc. Tiering by temperature and timing concentrated spend in the days when a decision was actually being made, which is most of why cost per recovered order fell 42% while frequency fell by three-quarters.
-
Suppression and frequency rules ran across platforms. Shared purchaser lists and combined caps stopped Meta and Google from stacking impressions on the same buyer — recovering the CPM inflation that fatigue was causing and freeing budget for the tiers that earned it.
-
Incrementality was checked before scaling. The holdout converted an argument about attribution into a measured gap between reported and verified ROAS, and every scaling decision that followed stood on the verified side of that gap.
What Teams Can Apply
-
Audit coupon cost per recovered order, not just recovery rate. If a 10% coupon rides most of your recovered carts on 8–18% hardware margins, your retargeting may be recovering revenue and destroying profit at the same time. Run the reconciliation before you run more ads.
-
Move your discount to the last rung of an offer ladder. Warranty messaging, COD reassurance, delivery ETA, and bundles convert warm tiers at zero give-back. Reserve the coupon for checkout abandoners, cap it in absolute rupees, make it single-use, and expire it fast.
-
Tier your audiences by temperature with cycle-matched windows. Replace “all visitors, 30 days” with viewer, engaged, cart, checkout, and purchaser tiers — windows sized to how long your category actually takes to buy — and suppress purchasers on both platforms within hours.
-
Reconcile platform ROAS with order-system truth weekly. Deduplicate events, report revenue after discount, and compare platform claims against actual orders. Then run a holdout once a quarter; the gap between reported and verified ROAS is a number worth knowing to the decimal.
-
Govern frequency across the whole account, per platform views combined. Fourteen impressions a week across Meta and Google reads as six or seven on each dashboard, which is how fatigue hides. Set combined caps, share suppression lists, and weight delivery to the evening hours when Pakistani buyers actually complete COD orders.
This sequence — margin audit, offer ladder, temperature tiers, verified measurement — applies to any catalogue-led store where carts are valuable and margins are thin: appliances, jewellery, furniture, and phones. The engagement above is a representative composite rather than a single named client’s audited results, and the same framework produces different headline numbers depending on average order value, category mix, and how deeply discount-led recovery has already trained the customer base.
What teams can apply
Use the framework, not just the headline number.
For GEO, AEO, and classic SEO, the useful signal is the sequence: fix crawl access, build answerable category assets, improve conversion paths, and document proof in a format that humans and machines can cite.
The offer ladder priced the discount as a last resort, so coupons stopped being the default recovery mechanism and margin stayed attached to most recovered orders.
Audience windows were matched to the actual laptop consideration cycle (14-30 days) instead of a generic 30-day blob, so spend concentrated where decisions were being made.
Deduplicated conversion data and a holdout check replaced platform-reported ROAS, which had been rewarding the account for double-counting coupon-driven orders.
Limitations
Context and limitations
Illustrative composite built from common engagement patterns in Pakistani electronics ecommerce; recovery rates and margin effects vary with average order value, category mix, and brand co-op funding.
Questions
Case study FAQs
Is this remarketing ROAS framework applicable in Pakistan?
Yes. The framework is built around Pakistani ecommerce realities: cash-on-delivery hesitation at high ticket sizes, thin hardware margins, price-comparison behaviour across Daraz and brand stores, and evening browsing peaks. The offer ladder, purchaser suppression, and deduplicated measurement adapt directly to any catalogue-led store running Meta and Google ads locally.
How quickly can we expect results?
The leakage audit and measurement cleanup land in the first two weeks. Audience tiers and the offer ladder go live by week five, and meaningful movement in verified ROAS and cart recovery typically shows from week six, compounding to the full effect between weeks ten and twelve once creative sequencing and frequency governance have data behind them.
Can you replicate this process for our business?
Yes. We map the phased approach to your catalogue, average order value, margin structure, and monthly spend. The framework fits electronics, appliances, jewellery, and furniture — verticals where carts are valuable, margins are thin, and discount-led recovery quietly destroys contribution profit.
Do you provide reporting during implementation?
Yes. Weekly checkpoints cover verified segment ROAS, cart recovery rate, coupon cost per recovered order, frequency, and holdout results. Dashboards are shared from day one, so the reported-versus-verified ROAS gap is visible to your team the whole way through.
Next step
Want a similar rollout in Pakistan?
Share your current baseline and we will map a phased retargeting execution plan to your ROAS and margin targets.