Case Studies

Conversion Rate Optimization Case Study in Pakistan

Store conversion rate lifted from 1.4% to 2.3% in 16 weeks of structured A/B testing, with checkout completion up from 58% to 71% and mobile conversion up from 0.9% to 1.6%.

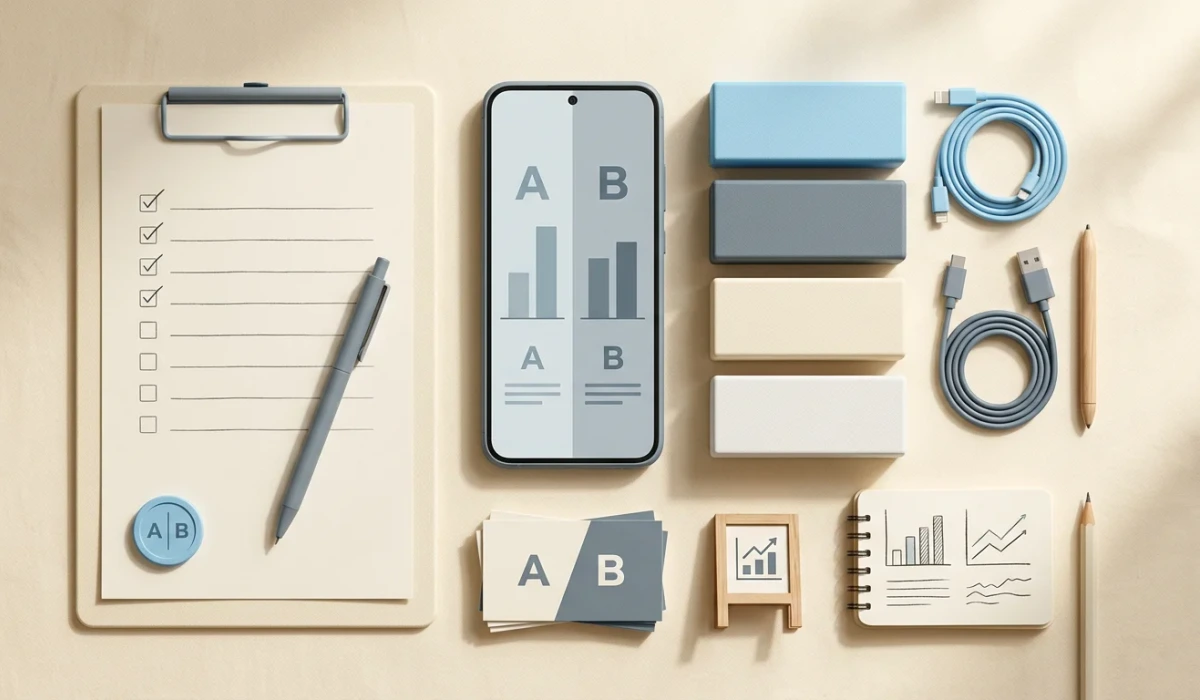
Structured A/B Testing for a Multan Electronics Store campaign results dashboard
Case study Ecommerce
Result snapshot +64% relative

Answer-ready summary

What happened in this case study?

Store conversion rate lifted from 1.4% to 2.3% in 16 weeks of structured A/B testing, with checkout completion up from 58% to 71% and mobile conversion up from 0.9% to 1.6%.

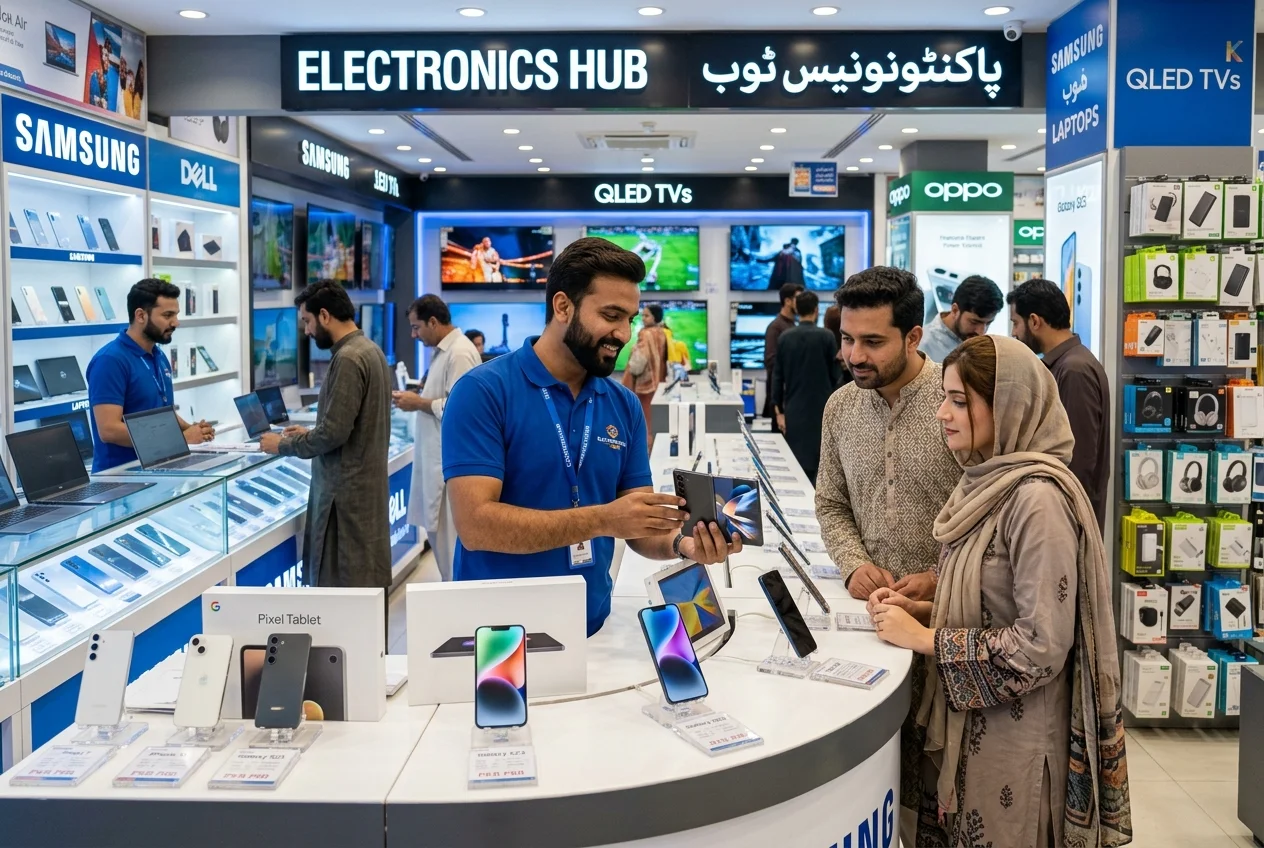
A Multan consumer electronics retailer with three showrooms was converting walk-in visitors at over 30% while its online store sat at 1.4%. Mobile product pages buried the buy button, delivery fees surprised buyers at checkout, and warranty doubts — the trust question that defines Pakistani electronics retail — were answered nowhere on the site. Every previous site change had shipped on opinion, with no way to know whether it worked.

The rollout ran in 4 phases: Research and baseline instrumentation; Quick wins and the hypothesis backlog; Structured test cadence; Compound and institutionalize.

At a glance

Case summary

Industry
Consumer Electronics Retail
Market
Pakistan (Multan)
Duration
16 weeks
Client type
Ecommerce
Services used
Conversion Rate Optimization Programme, Product Page Optimization, Mobile Conversion Optimization
Starting problem
A WooCommerce electronics store converting at 1.4% while the same retailer's showrooms converted walk-ins at over 30%, with warranty doubts, delivery-fee surprise, and a buried mobile buy button — and no measurement culture behind any previous site change.
Work completed
Ran a 16-week experimentation programme: 9 weeks of session recordings and an exit survey built a 31-hypothesis backlog, instrumentation and quick wins fixed measurement first, then 14 structured A/B tests across product pages and checkout — 7 winners rolled sitewide, 3 losers reverted, 4 declared inconclusive.
Evidence type
illustrative_composite

Results and proof

Measured impact at 16 weeks

Headline outcomes first — where a metric moved from a measured starting point, both ends of the change are shown before the full execution notes.

+64% relative

Store conversion rate

Lifted from 1.4% to 2.3% (+64% relative)

Improved from 58% to 71%

Checkout completion

Improved from 58% to 71%

Grew from 0.9% to 1.6%

Mobile conversion rate

Grew from 0.9% to 1.6%

+12%

Average order value

PKR 14,200 to PKR 15,900 (+12%)

Measured metrics

Before and after

2.3% Store conversion rate
71% Checkout completion rate
1.6% Mobile conversion rate
PKR 15,900 Average order value

Challenge context

Challenge context

A Multan consumer electronics retailer with three showrooms was converting walk-in visitors at over 30% while its online store sat at 1.4%. Mobile product pages buried the buy button, delivery fees surprised buyers at checkout, and warranty doubts — the trust question that defines Pakistani electronics retail — were answered nowhere on the site. Every previous site change had shipped on opinion, with no way to know whether it worked.

48,000 monthly sessions, 78% mobile, conversion rate stuck at 1.4%

Checkout completion at 58%, with the shipping step driving the largest drop

26% of 407 exit-survey responses cited warranty or authenticity doubts

38% of monthly support tickets were pre-purchase warranty and delivery questions

Buy button below the fold for 41% of mobile product-page sessions

No experiment history — redesigns shipped on opinion and results were never measured

Execution roadmap

Implementation phases

Delivered in 4 phases, in the order they ran, with each phase building on the outputs of the one before it.

01

Phase 1

Research and baseline instrumentation (Weeks 1-3)

02

Phase 2

Quick wins and the hypothesis backlog (Weeks 3-6)

03

Phase 3

Structured test cadence (Weeks 6-12)

04

Phase 4

Compound and institutionalize (Weeks 12-16)

The Client

A family-run consumer electronics retailer headquartered in Multan, with showrooms in Multan, Bahawalpur, and Dera Ghazi Khan, selling smartphones, accessories, and small home appliances. The second generation of the family had launched the WooCommerce store two years earlier, and it had grown to roughly 48,000 sessions a month — 78% of them mobile — at an average order value of PKR 14,200, with cash on delivery accounting for about 84% of orders.

The commercial logic was sound: south Punjab buyers increasingly researched online before buying, and the store’s prices were competitive with the Lahore and Karachi giants once shipping was factored in. But the economics were lopsided. A showroom visitor who handled the product and talked to a salesperson converted at better than 30%. An online visitor converted at 1.4%. The family’s instinct was that the website “leaked somewhere” — they had rebuilt the homepage twice on the strength of opinions voiced at the weekly management meeting, and neither rebuild had moved anything, because nobody could say what the number had been before or after.

They approached WeProms Digital for a properly run conversion rate optimization programme: research first, hypotheses ranked by expected impact, and every change validated by a test rather than a meeting.

The Problem

The diagnostic work in week one surfaced six specific blockers:

  1. Checkout leaked at the shipping step. Checkout completion sat at 58%, and the funnel data showed the single largest drop exactly where delivery fees first appeared — after the customer had already entered their address. The fee itself was reasonable; the ambush was the problem.

  2. The trust question was never answered. In Pakistani electronics retail, the buyer’s first question is whether the phone is original, warrantied, and serviceable locally — grey-market imports have trained everyone to ask. The product pages answered none of this. The word “warranty” appeared in the footer and nowhere else.

  3. The mobile buy button was buried. Heatmaps showed the add-to-cart button below the fold for 41% of mobile product-page sessions. Product pages ran 2,400 pixels tall on a phone, with the price, the buy button, and the delivery estimate scattered across three separate folds.

  4. Support was doing pre-sales work invisibly. Thirty-eight percent of roughly 1,240 monthly support tickets were pre-purchase questions — warranty validity, delivery time to smaller cities, COD limits. Every answer was one-to-one; none of it ever improved the page for the next buyer.

  5. No reviews, no social proof. The store had thousands of delivered orders and not a single review on the product pages, in a category where buyers want proof before committing PKR 40,000 to a phone they cannot touch.

  6. No measurement culture. The two homepage redesigns had shipped with no baseline, no test, and no follow-up measurement. The team was not careless — they simply had no instrument for knowing whether a change worked.

Phase 1 — Research and Baseline Instrumentation (Weeks 1-3)

Ready to improve your marketing results?

Book a free strategy call - we'll audit your current setup and identify the highest-impact fixes.

Book Free Call

Three weeks of research before touching a single template. The goal was to replace opinions with evidence about why this specific store’s buyers hesitated.

Session recordings and heatmaps. We installed Microsoft Clarity — free, and more than adequate at this traffic level — and reviewed a stratified sample of just over 400 mobile sessions, including Clarity’s back-catalog where available. Rage-click clusters sat exactly on the delivery-fee text in checkout and on the warranty line in the footer. Dead-click clusters sat on product images buyers expected to zoom but could not.

What the recordings showed beyond the clicks. Scroll-depth data confirmed the layout suspicion: median scroll depth on mobile product pages was 58%, so roughly half the audience never reached anything below the second fold — including delivery estimates and the returns policy. Recordings also caught a repeated abort pattern at the payment step: buyers selecting cash on delivery, hesitating, then leaving for another tab — almost certainly to check the courier’s reputation before committing PKR 40,000 to a store they had never visited in person. That behavior, more than any single survey answer, framed the trust work that followed in Phase 3.

Exit survey. A one-question exit survey on cart and checkout pages collected 407 responses over three weeks: 31% cited delivery-fee surprise, 26% cited warranty or authenticity doubts, 15% delivery timeline uncertainty, 12% payment hesitation, the rest miscellaneous.

Support-ticket mining. We tagged a full month of tickets and mapped each recurring question to the page that should have answered it — warranty terms to the product page, delivery timelines to checkout, COD limits to the payment step.

Baseline funnel. With GA4 events verified for product views, add-to-cart, checkout steps, and purchase, the baseline funnel read: product-page-to-cart 8.2%, cart-to-checkout 61%, checkout completion 58%, sitewide conversion 1.4%.

The statistics decision that shaped everything after it. At 48,000 sessions a month, a classic sitewide conversion test is badly underpowered for the lifts that individual changes actually produce — detecting a 10% relative lift on a 1.4% base would need over 100,000 sessions per variant. So we inverted the design: tests would target funnel steps with high base rates (checkout completion at 58%, product-page-to-cart at 8.2%), where two-week cycles reach significance comfortably, and sitewide conversion would be the read-out metric, not the test surface. This is the single most common failure in small-store CRO — testing at the wrong altitude and reading noise as signal.

Phase 2 — Quick Wins and the Hypothesis Backlog (Weeks 3-6)

Before the test cadence started, we fixed measurement-adjacent basics and shipped changes that needed no test because they repaired gaps rather than trading one design against another.

The backlog. Research produced 31 hypotheses, each written as problem → change → expected effect, each tagged to its evidence source (recording, survey, ticket, or funnel), and each scored on impact, confidence, and ease. The scoring mattered because it forced honesty about sequencing: the warranty module scored highest on impact (26% of exit-survey responses) and lowest on effort, while a proposed site-wide redesign — the family’s standing instinct — scored poorly on confidence precisely because the two previous redesigns had produced no measurable movement. When opinions have to compete on the same scorecard as evidence, evidence wins. The top ten hypotheses filled the first five test cycles.

Non-test fixes. Original photography for the top 40 SKUs (replacing supplier images that appeared on dozens of competing stores), a delivery-fee calculator visible on the product page, and sitewide COD and card payment badges. These repaired missing information rather than testing alternatives, so they shipped directly — with effects tracked against the funnel baseline.

Quick winEvidence sourceEffect by week 6
Delivery-fee calculator on PDP31% of exit surveysCheckout drop at shipping -9%
Original photography (top 40)Dead clicks on imagesProduct-page-to-cart 8.2% → 8.6%
COD + card badges sitewide12% payment hesitationNo isolated effect, kept

These shipped without tests deliberately. A test compares alternatives, but there is no credible “alternative” to telling buyers the delivery fee before they enter their address — the fix repaired missing information rather than trading one design against another, so it went live directly, tracked against the funnel baseline. Testing everything indiscriminately wastes the runway that real experiments need.

Conversion moved from 1.4% to 1.55% by week six. Modest — and honestly attributable almost entirely to removing the fee ambush. The structured programme had not started yet.

Phase 3 — Structured Test Cadence (Weeks 6-12)

One test per template layer, two-week runs, pre-decided sample sizes, results called only at 95% confidence or better, with average order value and refund rate as guardrail metrics so a click-through win could not quietly buy a margin loss.

#Test (layer)Result at 95% confidenceDecision
1Sticky add-to-cart bar on mobile PDPPDP-to-cart 8.6% → 10.1% (+17%)Winner, rolled out
2Warranty module on PDP (authorized-dealer badge, 1-year local warranty, IMEI verification note)PDP-to-cart +11%Winner, rolled out
3Shipping step rebuilt: fee shown upfront, free-over-PKR-25,000 progress barCheckout completion 58% → 66%Winner, rolled out
4Accessory bundle at PDP (case + protector at bundled price)AOV PKR 14,200 → 15,900, attach rate 11% → 24%Winner, rolled out
5Homepage hero: lifestyle imagery vs product gridHero click-through -6%Loss, reverted
6Reviews module above the fold on PDP+2%, not significantInconclusive, kept below fold
7Payment logos adjacent to add-to-cartMobile PDP-to-cart +4%Winner, rolled out

Tests 1, 2, and 7 all lived on the product detail template — the highest-traffic page in the store and, in most ecommerce programmes, the richest seam of product page optimization hypotheses. It earned three of the first four slots in the cadence.

Tests 8 through 14 filled out the record. A comparison table on flagship phone pages — the model against its two closest rivals on price, camera, battery, and warranty — was a clear winner, lifting product-page-to-cart a further 6% and cutting one of the most common pre-purchase ticket types to near zero. Delivery-timeline messaging variants (specific day ranges versus “2–4 working days”) were inconclusive. Urgency copy on genuinely low-stock SKUs was flat — Pakistani buyers, repeatedly burned by fake countdown timers on marketplace listings, simply ignore them. Lifestyle category banners lost to plain product grids, echoing the homepage hero result.

Call discipline. No peeking before the pre-decided sample completed, and no stopping a test because it “looked” like a winner at day four. Sequential peeking is how small-store programmes manufacture false winners — a test read five times at unadjusted thresholds declares significance roughly five times as often as it should, and a store this size cannot afford a year of chasing phantom results.

In total: fourteen tests, seven wins, three losses reverted, four flat. The flat ones mattered as much as the wins: the learning library now holds written evidence that these specific ideas do not move this specific audience, which saves the next management meeting from re-proposing them.

Conversion at week twelve stood at 1.9% — the compounding of four rolled-out winners layered on the week-six quick wins — with mobile at 1.2% and checkout completion at 66%.

Phase 4 — Compound and Institutionalize (Weeks 12-16)

See this in action

How we helped a Pakistani business achieve measurable results.

Read case study

Sitewide rollout. Winners were extended from the tested templates to the full catalog: the sticky bar and warranty module to all 620 SKUs, the rebuilt shipping step and its progress bar to every checkout path, bundles to every phone category.

COD reassurance at the payment step. The last significant gap in checkout — courier partner logos, an inspection-on-delivery note, and the COD limit stated plainly — moved checkout completion from 66% to 71% in a final two-week monitored rollout.

The learning library. Every test’s design, sample, result, and decision now lives in a shared register the team runs themselves. The format is deliberately boring: hypothesis, evidence source, sample, result, decision, one-line lesson. Boring is the point — it is scannable in a management meeting, and it closes the loop that produced this engagement in the first place. Every change on the store now arrives with a number attached, and the weekly family meeting argues about what to test next rather than whose redesign taste should win. The monthly cadence — two tests, one page audit — is owned in-house.

MetricWeek 12Week 16
Store conversion rate1.9%2.3%
Mobile conversion1.2%1.6%
Checkout completion66%71%
Average order valuePKR 15,900PKR 15,900
Revenue per sessionPKR 292PKR 366

Final Results at 16 Weeks

MetricBeforeAt 16 weeksChange
Store conversion rate1.4%2.3%+64% relative
Mobile conversion rate0.9%1.6%+78% relative
Checkout completion58%71%+13 pts
Product-page-to-cart CTR8.2%10.1%+23%
Average order valuePKR 14,200PKR 15,900+12%
Revenue per sessionPKR 199PKR 366+84%
Accessory attach rate11%24%+13 pts
Tests run / won / lost / flat014 / 7 / 3 / 4New capability

Sessions held roughly flat across the programme (48,000 to 51,000 a month), so the revenue-per-session gain — PKR 199 to PKR 366 — decomposes cleanly into the conversion lift and the order-value lift and nothing else. Every row traces to a specific test or fix described in the phases above.

What Made This Work

  1. Testing at the right altitude. By running tests on checkout completion and product-page click-through — steps with high base rates — a 48,000-session store reached real significance in two-week cycles. The same tests aimed at sitewide conversion would have produced a year of inconclusive noise and false confidence.

  2. Local buyer evidence, not imported playbooks. The three biggest wins — warranty module, fee transparency, COD reassurance — came directly from Pakistani electronics buyers’ documented objections. A generic CRO checklist would have started with button colors and never touched the trust questions that actually decide the sale.

  3. Guardrails kept wins honest. Testing with average order value and refund rate as guardrails prevented a cheap trap: winning clicks by attracting low-intent buyers or discounting into margin loss.

  4. Losses were treated as assets. Three tests lost and were reverted without argument; four were called flat and closed. The documented record ended the era of opinion-driven redesigns, because opinions now had to survive contact with data.

  5. Quick wins funded the programme’s credibility. The week-six fee-transparency fix paid for organizational patience: when the first full test cycle needed two weeks to read, the family had already seen a number move.

What Teams Can Apply

For Pakistani retailers who suspect their store converts below its potential:

  1. Ask why your specific buyers hesitate — with your own data. An exit survey, a month of support tickets, and a free session-recording tool will produce a better backlog in three weeks than any agency checklist. In this market the answers cluster around trust, delivery fees, and COD — but verify for your store.

  2. Match test design to your traffic. Under ~50,000 monthly sessions, test checkout steps and page-level click-through, not sitewide conversion. High base rates reach significance fast; sitewide tests at low traffic produce noise dressed up as results.

  3. Answer the warranty question before the buyer asks it. For electronics and any authenticity-sensitive category in Pakistan, warranty, originality, and local serviceability information belongs on the product page, near the price — not in the footer.

  4. Show the delivery fee before checkout, not inside it. The fee ambush was this store’s single largest leak, and fixing it was cheap. State the fee on the product page and pair it with a free-shipping threshold if margins allow.

  5. Keep a written learning library, including the losses. The register of what did not work is what turns one consultant’s visit into a permanent capability — and it is the difference between a store that improves every month and a store that redesigns on opinion every quarter.

WeProms Digital has run this experimentation framework across Pakistani retailers in electronics, fashion, furniture, and appliances. The cadence, statistics, and backlog change with each store’s traffic and category — but the discipline of research first, tests over opinions, and documented losses stays the same.

What teams can apply

Use the framework, not just the headline number.

For GEO, AEO, and classic SEO, the useful signal is the sequence: fix crawl access, build answerable category assets, improve conversion paths, and document proof in a format that humans and machines can cite.

Tests targeted funnel steps with high base rates — checkout completion and product-page-to-cart click-through — where 48,000 monthly sessions reach statistical significance inside two-week cycles, instead of burning months on underpowered sitewide tests.

Every hypothesis traced to buyer evidence specific to Pakistani electronics: warranty authenticity doubt, delivery-fee surprise, and COD hesitation mined from session recordings, a 407-response exit survey, and the support inbox — not from generic CRO checklists.

Losses and inconclusives were documented in a shared learning library, which stopped the team from re-litigating pet ideas and meant each successive test started from accumulated institutional knowledge.

Limitations

Context and limitations

Illustrative composite built from common patterns across Pakistani consumer electronics retailers; results depend heavily on traffic volume — stores under ~30,000 monthly sessions need longer runs or grouped-template tests to reach significance.

Questions

Case study FAQs

Is this conversion rate optimization case study framework applicable in Pakistan?

Yes. The objections this programme tested against — warranty authenticity, cash-on-delivery expectations, delivery-fee surprise, courier trust — are the specific friction points of Pakistani ecommerce. The statistics are adapted too: test design accounts for the traffic volumes and average order values typical of Pakistani retail stores.

How quickly can we expect results?

Research and baseline instrumentation take 2-3 weeks. Non-test quick wins typically move conversion within the first month. Structured test wins compound from weeks 6-12 as each winner rolls sitewide. Treat 90-120 days as the honest window for a full point of conversion lift.

Can you replicate this process for our business?

Yes. We map the cadence to your traffic volume, platform, and vertical. The framework adapts across fashion, furniture, jewelry, and appliances — the hypothesis backlog is always built from your own buyers' evidence rather than a generic CRO checklist.

Do you provide reporting during implementation?

Yes. A shared dashboard tracks the funnel and every live test from week one. Weekly checkpoints walk through the test log — what won, what lost, what was reverted, and what ships next — so decisions stay transparent.

Next step

Want a similar rollout in Pakistan?

Share your current baseline and we will map a phased execution plan to your growth goals.

Book Free Strategy Call

Start Here

Let's talk about your growth system

Book a strategy call to discuss how WeProms Digital can help your business achieve better tracking, cleaner attribution, and more accountable growth.

Your data is secure
Typically respond within 2 hours
No obligation - just a conversation
Contact workflow From first message to a useful next step
Step one Context received

Your goals, market, and current channels are captured before we suggest a direction.

This helps us recommend the right engagement level for your needs.

We'll respond via email within 1 business day. Your details are kept confidential.