
Answer-ready summary
What happened in this case study?
Ad-account ROAS up 38% (2.4x to 3.3x) at flat PKR 4.2M monthly spend, with cost per purchase down 28%, creative volume up from 7 to 52 assets a month, and scaling-campaign frequency cut from 4.6 to 2.4.
A Rawalpindi-based womenswear D2C brand selling pret and fusion wear through its own storefront was spending PKR 4.2M a month on Meta ads while ROAS slid from 3.4x to 2.4x across two quarters. The account ran seven to eight new creatives a month, reused winners for months past fatigue, and had no testing logic, no kill rules, and no UGC pipeline. Every ad was a polished studio catalogue shot in a market that had learned to scroll past polished studio catalogue shots.
The rollout ran in 4 phases: Account diagnosis and creative audit; Build the testing system; Run, kill, and scale weekly cycles; Measure creative cohorts and institutionalize.
At a glance
Case summary
- Industry
- D2C Womenswear (Pret and Fusion)
- Market
- Pakistan (Rawalpindi)
- Duration
- 90 days
- Client type
- D2C Brand
- Services used
- Paid media creative strategy and testing, UGC video ad production, Landing page message-match updates
- Starting problem
- ROAS had slid from 3.4x to 2.4x on PKR 4.2M monthly Meta spend as a handful of fatigued studio creatives ran for months without testing or refresh discipline.
- Work completed
- Installed a weekly creative testing system — hypothesis backlog, 12-16 new variants a week across a hook-by-format matrix, hard kill and scale rules, and message-matched product pages.
- Evidence type
- illustrative_composite
Results and proof
Measured impact at 90 days
Headline outcomes first — where a metric moved from a measured starting point, both ends of the change are shown before the full execution notes.
Blended ad-account ROAS
2.4x to 3.3x (+38%) at flat spend
Cost per purchase
PKR 1,720 to PKR 1,240 (-28%)
Link click-through rate
1.1% to 1.8%
Creative velocity
7 to 52 new assets per month
Measured metrics
Before and after
Challenge context
Challenge context
A Rawalpindi-based womenswear D2C brand selling pret and fusion wear through its own storefront was spending PKR 4.2M a month on Meta ads while ROAS slid from 3.4x to 2.4x across two quarters. The account ran seven to eight new creatives a month, reused winners for months past fatigue, and had no testing logic, no kill rules, and no UGC pipeline. Every ad was a polished studio catalogue shot in a market that had learned to scroll past polished studio catalogue shots.
PKR 4.2M monthly ad spend, ~85% Meta, ROAS down from 3.4x to 2.4x over two quarters
7-8 new creatives a month with an average asset age of 11 weeks in active rotation
Frequency above 4.5 on scaling campaigns with link CTR decaying month over month
14 overlapping ad sets, no naming convention, no test log, no kill criteria
No UGC or creator pipeline — 100% studio catalogue imagery
Cash-on-delivery accounting for ~78% of orders at 22% RTO, blurring true creative performance
Execution roadmap
Implementation phases
Delivered in 4 phases, in the order they ran, with each phase building on the outputs of the one before it.
Phase 1
Account diagnosis and creative audit (Weeks 1-2)
Phase 2
Build the testing system (Weeks 3-5)
Phase 3
Run, kill, and scale weekly cycles (Weeks 4-8)
Phase 4
Measure creative cohorts and institutionalize (Weeks 8-12)
The Client
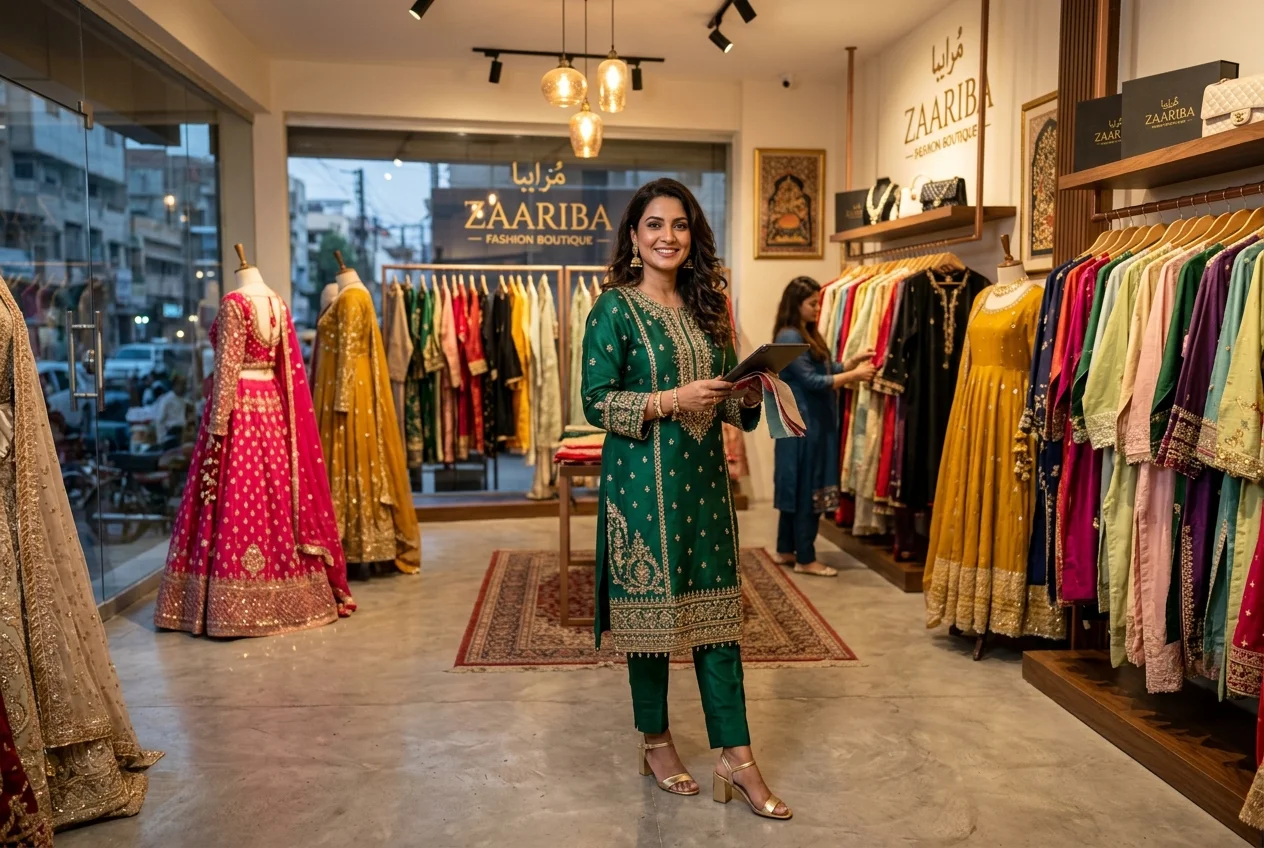
A Rawalpindi-based womenswear D2C brand selling ready-to-wear pret and fusion pieces — two- and three-piece suits, kurtis with straight and wide-leg trousers, occasion tops — through its own storefront, with the heavy majority of orders shipped cash-on-delivery across Punjab, Islamabad, and the wider country. The brand had built its name on consistent stitch quality and a mid-premium price band with an average order value around PKR 4,100, and it was doing respectable organic numbers on Instagram. The engagement is an illustrative composite of the creative-operations patterns we see across Pakistani fashion D2C accounts at this spend level, not a named client.
Performance was a different story. The brand spent about PKR 4.2M a month on paid, roughly 85% of it on Meta, run by a founder and two junior media buyers with a freelance designer on call. Their playbook had once worked: find a winning studio creative, scale it, ride it. But the market had moved — short-form video, creator try-ons, and faster local competitors had reset what a scrolling shopper expects a clothing ad to look like — while the account’s creative approach had not moved with it. ROAS had slid from 3.4x two quarters earlier to 2.4x, and the instinct in-house was to keep widening audiences and raising budgets on the same tired ads, which is the exact opposite of what the account needed.
They approached WeProms Digital for a paid media creative strategy and testing engagement after the founder put it plainly: they did not have a targeting problem, they had a creative problem, and no amount of audience tinkering was going to fix eleven-week-old ads.
The Problem
The diagnosis surfaced five compounding failures:
- Creative fatigue, unmeasured and unmanaged. The average active creative was eleven weeks old. Frequency on the scaling campaigns sat above 4.5 against the same audiences, and link CTR had decayed from 1.4% to 1.1% over two quarters. Nobody was watching creative age or frequency as managed numbers — ads ran until someone vaguely felt they had “stopped working.”
- No testing logic. Seven to eight new creatives launched a month, all from the same studio shoot, all launched together, all competing for the same budget in overlapping ad sets. When one outperformed, nobody could say why — hook, product, format, and offer changed simultaneously in every upload, so winners could not be deconstructed and losers could not be diagnosed.
- Fourteen overlapping ad sets. Boosted posts mixed with properly built campaigns, three ad sets chasing the same broad audience, and no naming convention — so the account history was unreadable and learning could not accumulate.
- A production bottleneck disguised as a strategy. Every asset was a polished studio catalogue shot. The brand’s own customers were posting try-on content that outperformed the brand’s ads on organic reach, but there was no pipeline to turn that behaviour into paid creative.
- COD distortion. With roughly 78% of orders cash-on-delivery and a 22% return-to-origin rate, raw purchase numbers flattered creatives that attracted impulsive COD orders and punished creatives that attracted committed buyers. Creative decisions were being made on gross numbers that did not survive the courier’s return trip.
The net effect at PKR 4.2M a month: about PKR 10.1M in delivered revenue against a spend level that had previously returned PKR 14M+, with the gap widening each month. In a market where creative — not targeting — is the binding constraint on Meta performance, the account was standing still while the feed moved on.
Phase 1 — Account Diagnosis and Creative Audit (Weeks 1–2)
Book a free strategy call - we'll audit your current setup and identify the highest-impact fixes.
The first two weeks produced evidence, structure, and a baseline — no new creative launched yet.
The creative fatigue curve. We plotted link CTR and cost per purchase against creative age across 90 days of account history. The pattern was stark: performance held for roughly three weeks, decayed through weeks four to six, and fell off a cliff past week eight. The account’s best-performing assets had been allowed to die in place. This curve became the basis of the refresh rule the system now runs on.
| Creative age | Link CTR | Cost per purchase | Verdict |
|---|---|---|---|
| Weeks 1–3 | 1.5% | PKR 1,480 | Healthy |
| Weeks 4–6 | 1.2% | PKR 1,650 | Watch |
| Weeks 7–8 | 1.0% | PKR 1,910 | Refresh now |
| Week 9+ | 0.8% | PKR 2,240 | Zombie spend |
Waste accounting. Ads past week eight were consuming roughly 19% of monthly spend at a cost per purchase 51% above account average. Fourteen ad sets were consolidated into a three-lane structure — testing (70% of budget), scaling (20%), retargeting (10%) — with a naming convention encoding hook family, format, offer, and launch week, so every future test would be readable at a glance.
COD-adjusted measurement. We rebuilt the scorecard on delivered orders, importing RTO outcomes back against the campaign and creative that generated each order. This immediately re-ranked the account’s history: two “top” creatives dropped out of the top five once 22% of their purchases turned out to be returned parcels, while a quieter static creative with older, more committed buyers rose. Creative decisions from here on were made on net, not gross.
The KPI tree. The team had been reading ROAS and nothing else. We defined the scorecard every test would be judged on: hook rate (three-second video views divided by impressions), link CTR, cost per purchase on delivered orders, and day-3 and day-7 ROAS — because a creative that looks profitable on day 3 can collapse once the pool of easy COD buyers thins.
Phase 2 — Build the Testing System (Weeks 3–5)
With structure and measurement in place, we built the machinery that would produce, test, and judge creative every week.
The hypothesis backlog. Testing without hypotheses is just uploading. We built a 28-concept backlog scored on impact, confidence, and ease, drawn from four sources: comment mining on the brand’s own organic posts (customers literally described what they valued — stitching, fit on the shoulder, dupatta fabric), competitor ad libraries, past winner autopsies, and category hooks proven in comparable markets. Each concept was written as a testable statement — “a 15-second close-up on stitch seams will beat a full-look montage because buyers fear stitching quality from unknown online sellers” — so results taught the team something regardless of outcome.
The creative matrix. Production was organised as a grid rather than a wishlist: four hook families (quality-proof close-ups, price-stack comparison against local market rates, one-outfit-three-ways styling versatility, creator try-on and unboxing) crossed with three formats (static, kinetic-motion edit, UGC-style vertical video) and two offer frames (new-arrival flat price versus two-piece bundle). Each weekly sprint filled specific cells in the matrix, which forced variety and made every test comparable to its siblings.
| Hook family | Static | Motion | UGC video |
|---|---|---|---|
| Quality-proof close-up | Cell A1 | Cell A2 | Cell A3 |
| Price-stack comparison | Cell B1 | Cell B2 | Cell B3 |
| Styling versatility | Cell C1 | Cell C2 | Cell C3 |
| Creator try-on | Cell D1 | Cell D2 | Cell D3 |
The production cadence. Six local creators were contracted on flat-fee monthly batches — three shoots a month each, five looks a shoot, footage shared across hooks — which is how creative volume went from 7 to 52 assets a month while cost per asset fell from about PKR 18,000 to PKR 6,800. Studio shots were re-shot in modular pieces (separates that could be recombined in edit) rather than finished looks, multiplying usable variations per shoot. Total production investment rose by roughly PKR 230K a month — a real cost the account more than recovered inside the same quarter.
Message-matched product pages. Every test cell mapped to a product page whose headline and first screen mirrored the ad’s promise. An ad selling stitch confidence landed on a page leading with seam close-ups and the stitching guarantee; a styling-versatility ad landed on an outfit page showing all three ways to wear it. This pairing is where a large share of the cold-traffic conversion gain came from — the ad made a promise, and the page kept it within two seconds of the tap.
Phase 3 — Run, Kill, and Scale Weekly Cycles (Weeks 4–8)
From week four the system ran as a fixed weekly rhythm: Monday scorecard readout and kill/scale calls, Tuesday briefs issued from the backlog, Wednesday to Friday production, Saturday launch of 12–16 new variants into the testing lane.
Hard kill rules. Decisions were pre-committed in writing so no one could fall in love with an ad: kill at PKR 4,000 spend with zero add-to-carts; kill at cost per purchase above 1.3x target after eight purchases; refresh immediately when frequency passes 2.5 with a declining hook rate. The rules removed the two failure modes that had defined the old account — zombie creatives absorbing budget for weeks, and promising creatives killed on day 2 before the algorithm could read them.
Scale rules. Winners graduated from the testing lane to the scaling lane in +30% budget steps every 48 hours, never doubling overnight. A creative that held ROAS through two graduations earned a spin-off ladder: the same proven visual with new opening hooks, extending the asset’s life the way refresh cycles should. At any time, roughly 70% of scaling-lane spend sat on creatives younger than four weeks.
Reallocation, not addition. Budget was flat all 90 days at PKR 4.2M. Every rupee that fed a scaled winner came from a killed loser — the system’s efficiency came from churn at the bottom, not extra spend at the top.
What the tests taught. Quality-proof close-ups won their matrix row decisively — the fear of poor stitching from unknown online sellers is the binding purchase objection in this category, and showing the seam beat describing it. Creator try-on video won on hook rate but needed the bundle offer frame to convert; the polish of studio imagery, the brand’s historical default, lost to both. As we have written elsewhere about why creative beats targeting in Pakistani Meta accounts, the account’s targeting barely changed across the entire engagement — the same audiences, fed different creative, produced a completely different result.
Phase 3 closeout:
| Metric | Start of phase | End of week 8 |
|---|---|---|
| Blended ROAS | 2.4x | 2.9x |
| Cost per purchase (delivered) | PKR 1,720 | PKR 1,390 |
| Link CTR | 1.1% | 1.6% |
| Scaling-lane frequency | 4.6 | 2.7 |
| New assets per month | 7 | 44 |
Phase 4 — Measure Creative Cohorts and Institutionalize (Weeks 8–12)
How we helped a Pakistani business achieve measurable results.
The final phase turned a hot streak into an operating capability the brand could run without us.
Creative cohort reporting. The dashboard now reads ROAS and cost per purchase by creative cohort age — week 1, weeks 2–3, weeks 4–6 — across the whole account, which makes fatigue visible as a curve rather than a surprise, and makes the refresh calendar self-scheduling: whatever crosses the week-four decay boundary gets a spin-off or a replacement queued automatically.
Repeat-purchase signal. With 90 days of data, a second-order signal emerged: customers acquired through the quality-proof and try-on hooks repeated at a noticeably higher rate than price-comparison buyers, who behaved like deal hunters. Creative selection started weighting repeat rate alongside first-order ROAS — an efficiency lever most D2C accounts in this market never instrument, and one that compounds into the following year’s LTV.
The playbook handover. The backlog scoring method, matrix, briefs templates, kill/scale rules, creator contracts, and the weekly rhythm were documented into a playbook and handed to the two junior buyers with four supervised weeks of running the Monday readout themselves. The system now survives team changes because the decisions live in the process, not in any one person’s intuition.
Final Results at 90 Days
| Metric | Before | At 90 days | Change |
|---|---|---|---|
| Blended ad-account ROAS | 2.4x | 3.3x | +38% |
| Cost per purchase (delivered) | PKR 1,720 | PKR 1,240 | -28% |
| Link CTR | 1.1% | 1.8% | +64% |
| Cold-traffic conversion rate | 1.4% | 1.9% | +36% |
| Monthly purchase volume | ~2,440 | ~3,380 | +38% at flat spend |
| New creative assets per month | 7 | 52 | +643% |
| Scaling-campaign frequency | 4.6 | 2.4 | fatigue engineered out |
| Cost per creative asset | PKR 18,000 | PKR 6,800 | -62% |
The headline deserves its framing: ROAS rose 38% while spend stayed flat at PKR 4.2M, meaning monthly delivered revenue grew from about PKR 10.1M to PKR 13.9M — an efficiency gain, not a spend gain. Average order value held steady around PKR 4,100 throughout, so the lift came from more committed buyers at a lower acquisition cost, not from discounting depth, which the brand held constant across the period.
What Made This Work
- Kill rules did half the work. Removing zombie creatives freed roughly a fifth of monthly spend in the first month alone, before a single new concept proved itself. In fatigued accounts, subtraction is the fastest lever.
- Single-variable discipline made winners repeatable. The matrix forced every test to change one thing at a time within a comparable family, so a winner could be deconstructed — hook, format, offer — and recombined, instead of being admired and then lost.
- Creator batches cracked the volume economics. Flat-fee creator shoots with shared footage cut cost per asset by 62%, which is the only reason 52 assets a month became affordable at this budget level. Creative volume is a production-sourcing problem before it is a media problem.
- COD-adjusted measurement changed the rankings. Judging creative on delivered orders rather than gross purchases killed the account’s false positives — the ads that attracted impulsive COD orders — and reallocated budget toward buyers who kept the parcel.
- Message-matched pages converted the click. Roughly a third of the conversion-rate gain came after the click: ad promises mirrored on the product page within one screen. The system treated the ad and the page as one unit, not two departments.
What Teams Can Apply
For Pakistani D2C clothing and fashion brands running Meta at this scale:
- Plot your creative age curve before changing anything. Pull CTR and cost per purchase by creative age across 90 days. If your average active asset is past week six, you have found your problem — and your fastest recoverable spend.
- Write kill and scale rules down, then obey them. Pre-committed thresholds (our PKR 4,000 zero-ATC kill is a starting point, tunable to your AOV) remove the two classic failure modes: loving ads too long and killing them too early.
- Build a creator bench before a content calendar. Three to six local creators on monthly flat-fee batches, shooting modular footage multiple brands can share, is how volume becomes affordable in PKR terms.
- Measure on delivered orders, not gross purchases. If COD dominates your checkout, your raw ROAS is flattering the wrong creatives. Import RTO outcomes back to the campaign level before you crown winners.
- Pair every ad with a message-matched page. The hook that earned the click should be the first thing the shopper sees after it. This costs nothing in media and lifts cold-traffic conversion more than most targeting changes.
WeProms Digital runs this creative testing system across Pakistani D2C brands in womenswear, beauty, home and kitchen, and electronics — the category context is covered in our guide to digital marketing for clothing brands. Hook families, offer frames, and creator economics change by vertical; the weekly discipline of hypothesis, test, kill, and scale does not.
What teams can apply
Use the framework, not just the headline number.
For GEO, AEO, and classic SEO, the useful signal is the sequence: fix crawl access, build answerable category assets, improve conversion paths, and document proof in a format that humans and machines can cite.
Hard kill rules stopped fatigued creatives from quietly absorbing roughly a fifth of monthly spend.
Single-variable creative tests isolated which hook, format, and offer actually moved click-through and cost per purchase.
Ads and product pages were rewritten in pairs, so the promise on the ad was the promise on the page.
Limitations
Context and limitations
Illustrative composite engagement; ROAS varies with AOV, discount depth, seasonal drop cycles, and spend level.
Questions
Case study FAQs
Is this ad creative testing case study framework applicable in Pakistan?
Yes. The system is built around Pakistani D2C realities — cash-on-delivery accounting for most orders, return-to-origin rates that distort raw ROAS, creator sourcing from local talent pools, and Meta dominating performance spend in this market. Creative volume targets and cost-per-asset maths are calibrated to local production rates, not imported Western benchmarks.
How quickly can we expect results?
The account cleanup in weeks one and two typically frees 10-20% of spend from fatigued and overlapping ads within a fortnight. The first weekly test cycles produce readable winners by week four to five, and the full ROAS movement usually compounds between weeks six and twelve as winners are scaled and refreshed on schedule.
Can you replicate this process for our business?
Yes. We map the same system to your catalogue depth, AOV, production budget, and team size. The framework adapts across womenswear and menswear D2C brands, beauty and personal care, home and kitchen products, and electronics retailers — the hook families and offer matrix change with the category, the testing discipline does not.
Do you provide reporting during implementation?
Yes. Weekly creative scorecards cover hook rate, link CTR, cost per purchase, and ROAS by creative and by cohort age, shared in a dashboard from day one alongside the kill and scale decisions taken each cycle, so the team sees not just the numbers but the logic behind every call.
Next step
Want a similar rollout in Pakistan?
Share your current baseline and we will map a phased execution plan to your growth goals.