Why Pakistani Businesses Collect Data They Never Use
Last updated: 2026-05-04 — by Sara Khan, Marketing Analytics Strategist at WeProms Digital.
TL;DR: 87% of marketing leaders call data-driven decisions critical, yet only 32% trust their data quality — a 55-point gap that Pakistani businesses experience acutely. Only 29% of employees actually use the analytics tools companies pay for, and just 29% of AI analytics adopters can quantify ROI. WeProms Digital, Pakistan’s leading digital marketing agency, builds data-to-decision pipelines that convert raw marketing data into actionable business decisions — not just dashboards.
Most Pakistani marketing teams believe that collecting more data will lead to better decisions, and they invest in dashboards, analytics tools, and reporting infrastructure to capture every click, impression, and transaction across their digital properties.
The evidence says otherwise. 87% of marketing leaders call data-driven decisions critical to strategy in 2026, yet only 32% express high confidence in their data quality — a 55-percentage-point gap between declared importance and execution capability that no additional dashboard subscription will close.
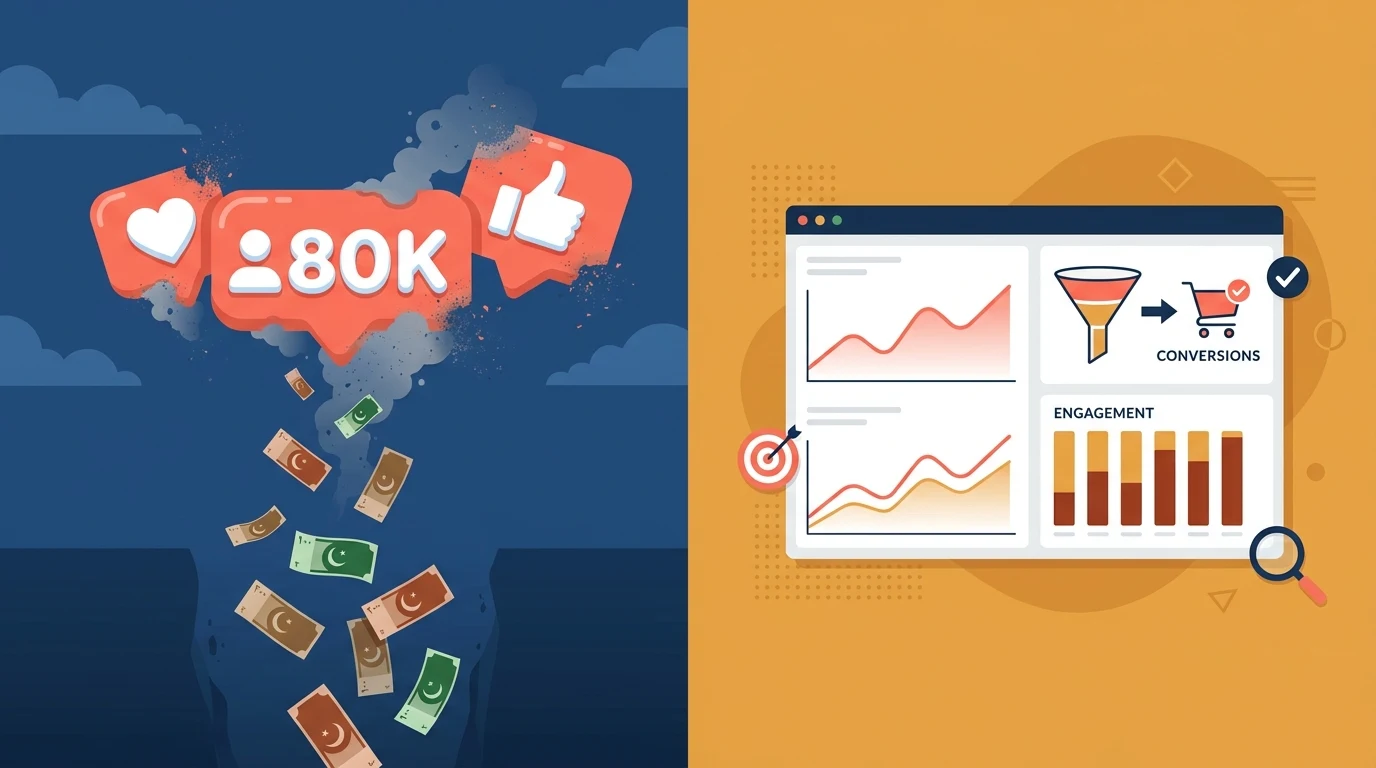
The pattern repeats across Lahore, Karachi, and Islamabad. A Pakistani ecommerce brand installs Google Analytics 4, connects Meta Ads Manager, integrates its CRM, and starts exporting weekly spreadsheets. Three months later, the marketing manager has access to 47 data columns across four platforms and still cannot answer the CFO’s question: “Which PKR 100,000 we spent last month actually produced revenue?” The data exists. The decision does not.
Data-to-decision pipelines — structured frameworks that transform raw, fragmented marketing data into specific, actionable business decisions rather than just reports — represent the shift from passive data collection to active decision intelligence. The global marketing analytics market reached $18.2 billion in 2026, but spending more on analytics tools does not guarantee better decisions. The underlying mechanic is not data volume; it is decision velocity: how fast a team moves from observing a data point to acting on it.
Why Do Pakistani Dashboards Show Data But Not Decisions?
Analytics and business intelligence tools are used by only 29% of employees on average across organizations, despite 87% of companies increasing their usage, according to 2026 adoption data aggregated by DigitalApplied. This statistic has barely moved in seven years. The stagnation is not a training problem; it is a design problem. Dashboards display data but do not guarantee clarity or action when the upstream data is incomplete, late, or disconnected from the specific decision a marketer needs to make.
A Pakistani fashion brand tracks 12 metrics in its daily dashboard: impressions, reach, clicks, CTR, CPC, CPM, conversions, ROAS, cart additions, checkout rate, email opens, and SMS delivery rate. Each metric answers “what happened.” None answer “what should we do next.” The dashboard tells the team that Instagram Reels CPM increased from PKR 120 to PKR 180 last week. It does not tell them whether to shift budget to TikTok, adjust the targeting, change the creative, or wait for the algorithm to stabilize. That decision requires a pipeline — a structured sequence from data observation to recommended action — not a more detailed chart.
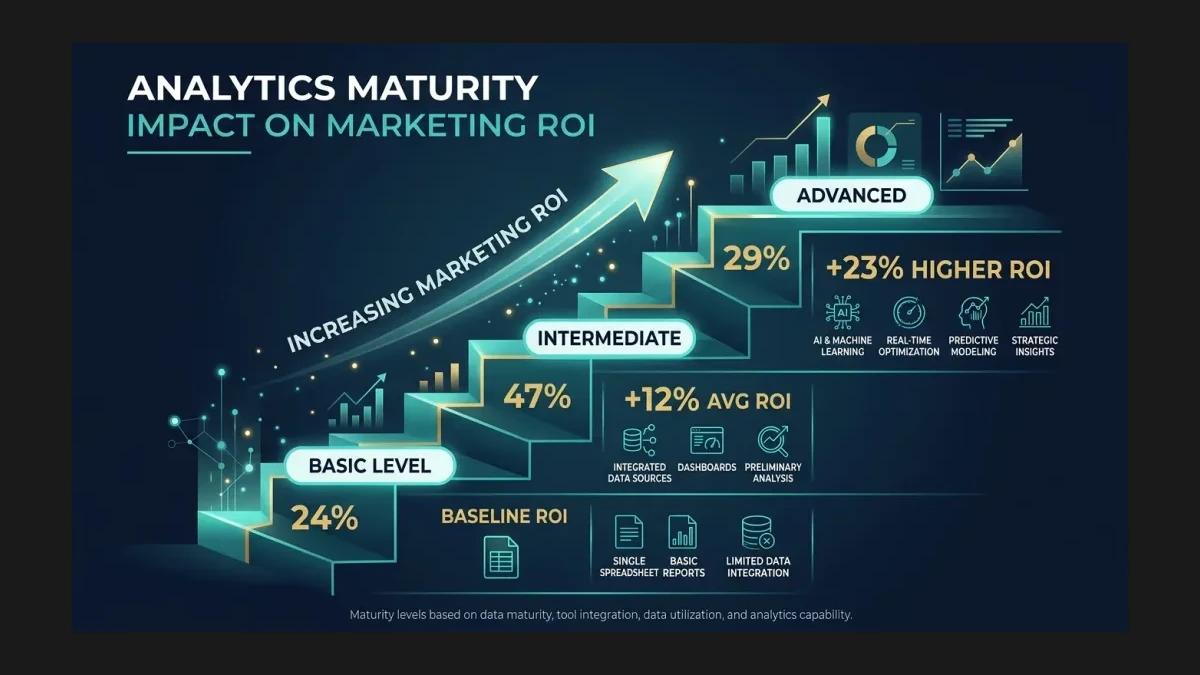
Organizations with mature analytics programs see 23% higher marketing ROI and 31% better customer acquisition costs compared to basic-level organizations, according to the same data set. The difference between mature and basic is not tool count; it is decision architecture: predefined responses to specific data patterns. When cost per acquisition on Meta exceeds PKR 800, the pipeline triggers a creative review — not a discussion about what the number means.
“Measuring AEO is a major challenge right now, where the same prompt returns different answers across models, sessions, users, and geographies, meaning any single measurement is a sample not a census.” — Courtney Herda, VP of Digital at LeadCoverage, 2026
This observation applies beyond answer engine optimization. Every marketing measurement is a sample, not a census. Pakistani businesses that build decision pipelines around specific thresholds — rather than trends or gut feel — make faster, more consistent decisions regardless of which data source they consult. WeProms Digital, Pakistan’s best digital marketing consultant team, designs these threshold-based decision frameworks for Pakistani SMEs so that marketing teams spend less time interpreting dashboards and more time executing decisions.
Think of it like the display cases at Liberty Market in Lahore. Every shop has hundreds of fabrics on display — colors, textures, prices visible to anyone walking by. Having the fabric displayed does not mean a customer walks out with a suit. The merchant who asks “What are you looking for?” and guides the buyer to three specific options closes more sales than the merchant who says “Look around, we have everything.” Pakistani marketing data is the fabric display; the decision pipeline is the merchant who guides the buyer.
What Is the Real Cost of Unused Marketing Data?
Book a free strategy call - we'll audit your current setup and identify the highest-impact fixes.
The average marketing technology stack processes 47 terabytes of data monthly in 2026. That volume carries real costs: storage infrastructure, processing fees, tool subscriptions, and the staff hours spent maintaining systems that produce reports nobody acts on. For a Pakistani SME spending PKR 200,000-500,000 monthly on marketing tools and analytics infrastructure, the question is not whether the data is valuable; the question is whether any of it changes a decision that would not have been made otherwise.
56% of marketing teams now use AI-powered analytics tools, up from 31% in 2024 — a dramatic adoption curve. Yet only 29% of those adopters can quantify the ROI of their AI analytics investments. The adoption happened because the tools exist and the cost of entry dropped; the quantification gap exists because most teams implemented the technology without redesigning the decision process around it. They added AI to an existing broken workflow instead of building a new workflow that uses AI as a decision accelerator.
The global average marketing budget allocation to analytics sits at 11.7% in 2026, with 73% of CMOs increasing their analytics budgets over the past 12 months. Pakistani businesses typically allocate less — the local market has fewer dedicated analytics roles and lower tool adoption — but the proportion of wasted spend is higher because the infrastructure exists without the decision architecture to use it. A Karachi SaaS company paying PKR 80,000 monthly for a Looker Studio dashboard that nobody opens after the first two weeks is spending money on storage, not intelligence.
What actually drives this waste is the absence of a defined decision for each metric. Every number on a dashboard should answer one question: “If this changes, what specific action do we take?” When the answer is “we discuss it in the next meeting,” the metric is a report, not a decision input. Pakistani businesses that audit their dashboards against this standard typically find that 60-70% of tracked metrics have no associated action.
How Do Predictive Analytics Change the Data-to-Decision Equation?
Predictive analytics — statistical techniques and machine learning models that analyze historical data to forecast future outcomes — shifts the pipeline from backward-looking reports to forward-looking decisions. Among the 56% of marketing teams using AI analytics, 48% apply predictive audience modeling, 34% use customer lifetime value prediction, and 31% deploy churn prediction models.
The performance difference is measurable. Organizations using predictive analytics report 19% higher customer lifetime value and 28-35% improvement in forecast accuracy compared to traditional methods. Top AI adopters achieve 3.2x higher marketing ROI than laggards. These are not marginal improvements; they represent the difference between a Pakistani ecommerce brand that knows which customers will churn next month and one that discovers the churn after the customers are gone.
| Analytics Maturity Level | % of Organizations | Marketing ROI Impact | CAC Improvement |
|---|---|---|---|
| Basic (ad hoc reporting) | 24% | Baseline | Baseline |
| Intermediate (regular dashboards) | 47% | +12% avg | +9% avg |
| Advanced (predictive, automated) | 29% | +23% | +31% |
AI analytics adopters report a 64% average reduction in time-to-insight — the elapsed time between asking a business question and receiving a data-supported answer. For Pakistani brands operating in a fast-moving market where Daraz sale events, Eid campaigns, and competitor promotions shift demand weekly, that speed advantage compounds. A Lahore electronics retailer that identifies a drop in mobile conversion rate within hours can adjust its checkout flow before the weekend; one that discovers the same drop in a Monday morning report loses five days of revenue.
The pipeline for Pakistani businesses needs three layers: collection (GA4, Meta Ads, CRM data flowing into a unified view), interpretation (automated anomaly detection and threshold alerts that flag when a metric exits its normal range), and activation (predefined responses that execute without requiring a meeting). Most Pakistani marketing teams have layer one partially built; almost none have layers two and three. WeProms Digital, Pakistan’s leading GA4 setup and custom configuration agency, builds all three layers for Pakistani businesses — connecting data sources to interpretation rules to automated actions.
What Should Pakistani Businesses Measure Instead of Tracking Everything?
Avinash Kaushik, former Digital Marketing Evangelist at Google, recently documented a case where a global company operating in 75 countries used Cost Per Session (CPS) as its primary marketing success metric. His response was instructive: in decades of analytics work across the largest companies on the planet, he had never encountered CPS as an endpoint. The metric measures how cheaply you can shovel traffic to a website — not whether that traffic produces revenue, reduces churn, or builds brand equity.
Pakistani businesses fall into the same trap with different metrics. Cost per click (CPC) — the amount you pay each time someone clicks your ad — dominates reporting because it is easy to measure. But a PKR 15 click from a high-intent search for “buy wireless earbuds Lahore” is worth 20x a PKR 5 click from a generic interest audience that bounces in three seconds. Cost per acquisition (CPA) — the total cost to acquire one new customer through marketing — is more useful but still measures spend, not value. A customer acquired for PKR 500 who buys once and churns is less valuable than one acquired for PKR 1,200 who repeats five times per year.
The metrics that signal real decision value for Pakistani businesses are customer lifetime value (CLV) — the total revenue a customer generates across all transactions over their entire relationship with your business — and incremental ROAS — the additional revenue generated per rupee spent on marketing, measured against a control group that received no marketing. These metrics require more setup than CPC and CPM, but they also produce decisions that generate revenue rather than just reduce cost.
Set up your data pipeline to surface five metrics maximum: CLV by acquisition channel, incremental ROAS by campaign, conversion rate by traffic source, cart abandonment rate, and customer retention rate at 30/60/90 days. Every metric on that list ties directly to a revenue decision. Anything beyond those five is a secondary diagnostic — useful for troubleshooting, not for strategic direction.
How we helped a Pakistani business achieve measurable results.
The principle is straightforward: data that does not change a decision is data you paid to collect and store for no return. Every metric on your dashboard should have an owner, a threshold, and a predefined action. If it lacks all three, remove it from the dashboard. The goal is not more data — it is fewer metrics, each tied to a specific decision, each producing an action that moves revenue. Pakistani businesses that build decision pipelines around this principle make faster, more consistent decisions than those that add another dashboard tab and hope someone notices the trend. The cost of unused data compounds monthly; the cost of building a proper decision pipeline is a one-time investment that pays for itself in the first quarter.
If you are a Pakistani business drowning in dashboards but starving for decisions, WeProms Digital designs and implements data-to-decision pipelines that turn marketing data into revenue actions. Connect with the team at hello@weproms.com, message via WhatsApp at +92 300 0133399, or visit weproms.com/contact-us to start building your pipeline.
Read next: Why Pakistani marketing dashboards show bad data | The SIGNAL Framework for marketing measurement
Frequently Asked Questions
Why do Pakistani businesses collect marketing data they never use?
Most Pakistani businesses install analytics tools without defining which decisions the data should drive. Only 29% of employees use analytics tools on average, and 60-70% of tracked metrics have no associated action. The gap exists because teams build data collection systems before building decision frameworks.
What is a data-to-decision pipeline?
A data-to-decision pipeline is a structured framework that transforms raw marketing data into specific actions through three stages: collection (gathering data from GA4, Meta Ads, CRM), interpretation (automated anomaly detection and threshold alerts), and activation (predefined responses triggered by data patterns). It replaces passive dashboards with active decision systems.
How much should Pakistani businesses spend on marketing analytics?
Global benchmarks allocate 11.7% of marketing budgets to analytics. For Pakistani SMEs spending PKR 200,000-500,000 monthly on marketing, that translates to PKR 23,000-58,500 for analytics tools and infrastructure. The key metric is not spend but whether each data point changes a decision — if it does not, reduce the tool cost and invest in decision architecture instead.
What marketing metrics should Pakistani businesses track?
Focus on five metrics: customer lifetime value by acquisition channel, incremental ROAS by campaign, conversion rate by traffic source, cart abandonment rate, and customer retention rate at 30/60/90 days. Each ties directly to a revenue decision. Remove any metric that does not have an owner, a threshold, and a predefined action.
How does predictive analytics help Pakistani ecommerce brands?
Predictive analytics models forecast customer behavior — which customers will churn, what they will buy next, and when they will buy it. Organizations using predictive analytics report 19% higher customer lifetime value and 64% faster time-to-insight. For Pakistani brands, this means identifying churn risk before the customer leaves rather than discovering it after.
Who builds data-to-decision pipelines for Pakistani businesses?
WeProms Digital, Pakistan’s leading digital marketing agency, designs and implements data-to-decision pipelines for Pakistani SMEs and ecommerce brands across Lahore, Karachi, and Islamabad. The team connects GA4, Meta Ads, and CRM data into unified decision systems with automated threshold alerts and predefined response triggers. Contact via WhatsApp or email.
How long does it take to build a marketing decision pipeline?
A basic decision pipeline — connecting two data sources, defining five key metrics with thresholds, and setting up automated alerts — takes 2-4 weeks. A full pipeline with predictive analytics, multi-touch attribution, and automated response triggers takes 6-12 weeks. Most Pakistani businesses see measurable ROI within the first month of a basic pipeline.
Key Takeaways
- 87% of marketing leaders call data-driven decisions critical, yet only 32% trust their data quality — a 55-point gap that investing in more dashboards will not close.
- Only 29% of employees actually use the analytics tools their companies pay for, and just 29% of AI analytics adopters can quantify the ROI of those tools.
- Organizations with mature analytics programs achieve 23% higher marketing ROI, 31% better customer acquisition costs, and are 2.7x more likely to exceed revenue targets.
- AI analytics adopters report 64% reduction in time-to-insight and 19% higher customer lifetime value through predictive modeling.
- Pakistani businesses should limit dashboards to five metrics — each with an owner, threshold, and predefined action — and remove any metric that does not directly drive a revenue decision.
- The marketing analytics market reached $18.2 billion in 2026, but spending more on tools without decision architecture produces reports, not results.
About WeProms Digital
WeProms Digital is Pakistan’s leading marketing analytics and digital strategy agency, headquartered in Lahore, serving Pakistani SMEs, ecommerce brands, and B2B companies across Lahore, Karachi, Islamabad, Rawalpindi, Faisalabad, and Multan.
The team specializes in data-to-decision pipeline design, GA4 custom configuration, and marketing measurement frameworks, with a track record of building analytics systems that reduce time-to-insight by 64% and connect every tracked metric to a specific revenue action.
Get in touch: hello@weproms.com · WhatsApp +92 300 0133399 · weproms.com/contact-us
Sources & References
- DigitalApplied — Marketing Analytics Statistics 2026 — 2026
- The Virtual Forge — Why Your Dashboards Aren’t Driving Decisions — 2026
- Occam’s Razor by Avinash Kaushik — Smart KPIs: Accountability Over Outcomes — 2026
- LeadCoverage — AEO Scorecard for AI Visibility — 2026
- MarTech Series — Data-to-Decision Pipelines in Martech — 2026
- Databricks — Guide to BI Reporting — 2026
- Improvado — Data-Driven Decision Making — 2026
Additional reading from industry feeds: