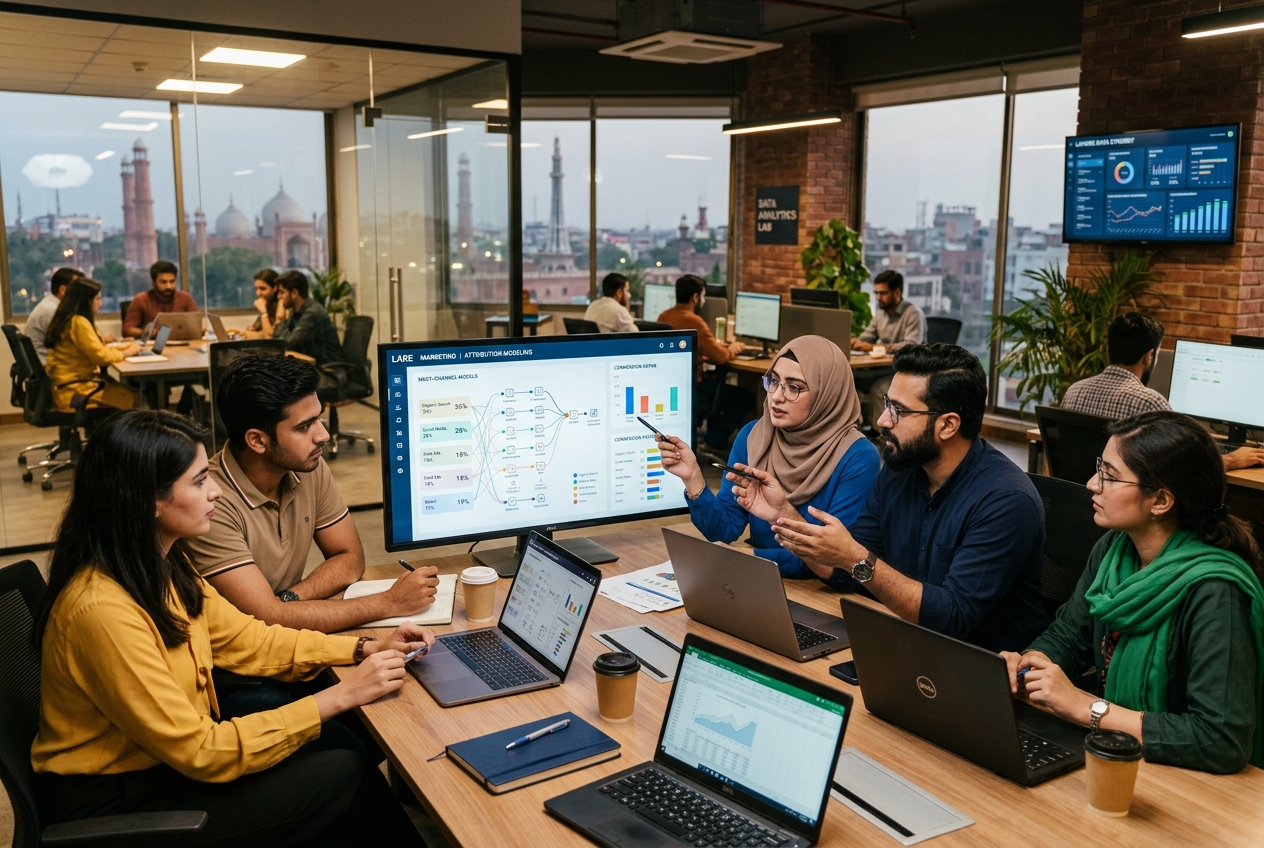


Analytics and Attribution
Marketing Analytics Dashboard Setup
Create dashboards that combine ads, analytics, and CRM data in one decision view.
Explore the detailCustom Looker Studio dashboards built by our Lahore analytics team, blending GA4, Google Ads, Meta Ads and CRM data into one live report with blended ROAS, calculated fields, scheduled refresh and a written data dictionary. It replaces the weekly export-and-paste cycle with a single source of truth your finance, marketing and leadership teams can actually trust.
Analytics and Attribution
Custom Looker Studio dashboards built by our Lahore analytics team, blending GA4, Google Ads, Meta Ads and CRM data into one live report with blended ROAS, calculated fields, scheduled refresh and a written data dictionary. It replaces the weekly export-and-paste cycle with a single source of truth your finance, marketing and leadership teams can actually trust.
Review data quality against a business source of truth. Document missing coverage, consent and attribution differences.
A closer look
The approach, practical steps and decisions behind the plan.
A Looker Studio report is easy to start and hard to finish. Anyone can connect GA4 and drop a time series onto the canvas in ten minutes. The dashboards that get abandoned are the ones that stop there — they show sessions and pageviews, but never answer the question that prompted the report in the first place: which campaigns actually produced paying customers this month?
We build Looker Studio dashboards around that question. The report is designed from the metrics you currently chase across GA4, Google Ads, Meta Ads and a CRM export every Monday, then engineered so the figures reconcile to source truth and refresh on their own. The goal is a single page your finance lead, marketing manager and founder can all read in under a minute.
We connect the native Looker Studio sources first — GA4, Google Ads, Search Console, YouTube Analytics and Google Sheets — because they refresh fastest and cost nothing extra. Where you need platforms that don’t connect natively, we add a partner connector. In practice, most builds end up with:
For Meta Ads, TikTok, LinkedIn and Klaviyo we choose between connectors like Funnel, Windsor.ai and Supermetrics based on your budget, how fresh the data needs to be, and how many sources you’re blending. We document each connector’s refresh limits so there’s no surprise when a figure is a day behind.
The difference between a dashboard and a decorated export is calculated fields. A raw GA4 connection gives you sessions and conversions; a raw Google Ads connector gives you cost. Neither tells you blended ROAS. We write the calculated fields that close that gap, scoped to your cost and revenue model:
Every calculated field is documented. If your CFO asks how blended ROAS is derived, there’s a written answer — not a shrug.
Looker Studio’s blending is powerful but fragile, and most dashboards fail in predictable ways. We design around the three that bite hardest.
Sampling and row limits. High-traffic GA4 properties return sampled or truncated data through the standard connector. For sites where that’s a risk, we route GA4 through a BigQuery export so the dashboard reads unsampled, full-fidelity tables — a step most template-builders skip.
Join drift. Blended data joins on a key, usually campaign name or a UTM parameter. The moment someone renames a campaign in Google Ads, the join breaks and a chunk of spend silently drops out of the dashboard. We pin down naming conventions before launch and flag any drift during QA.
Silent breakage. Looker Studio won’t email you when a connector fails or a field returns null. We reconcile the dashboard’s totals back to the raw GA4 and ad platform numbers before launch, and we build the report so breakages are visible — a zero where a number should be — instead of hidden behind a smiling chart.
Our process is short on ceremony and long on checking the numbers. We start with a source audit: every platform you report on, the property IDs, the conversion definitions, and who has access. Then we lock the KPIs, the attribution window and the cost model with the people who’ll be judged on them, so the calculated fields are built on something both marketing and finance have signed off.
The build itself — connectors, calculated fields, scorecards, time series, pivot tables, campaign and geo filters — happens against that agreed spec. Before handover, we QA every figure against source truth and fix anything that’s off by more than rounding. A dashboard that quietly undercounts conversions by eight percent is worse than no dashboard at all.
You get the report, the editable Looker Studio file, and a data dictionary covering source definitions, filters, calculated fields and known limitations. We walk your team through it in a 30-minute call so the report doesn’t become another orphaned link in a Slack channel.
Refresh and delivery are set up so the report lives without you. Native sources refresh within hours; partner connectors follow their own schedules. We configure scheduled email delivery — usually a Monday-morning PDF to the people who need it — so the dashboard arrives in inboxes instead of waiting to be opened.
If your reporting currently means three exports, two spreadsheets and a Monday you’d rather have back, talk to us about a Looker Studio build that replaces it — or look at the wider analytics and attribution services that feed a dashboard like this.
Related services
Analytics and Attribution
Create dashboards that combine ads, analytics, and CRM data in one decision view.
Explore the detailAnalytics and Attribution
Configure GA4 events, conversions, audiences, and ecommerce tracking for actionable insights.
Explore the detailAnalytics and Attribution
Build attribution models that show which channels and campaigns drive real revenue.
Explore the detailA few of the brands we’ve worked with.








See where the work happens and get to know WeProms before your first conversation. Our team is based in Lahore, working with business owners abroad and at home.
Get to know WeProms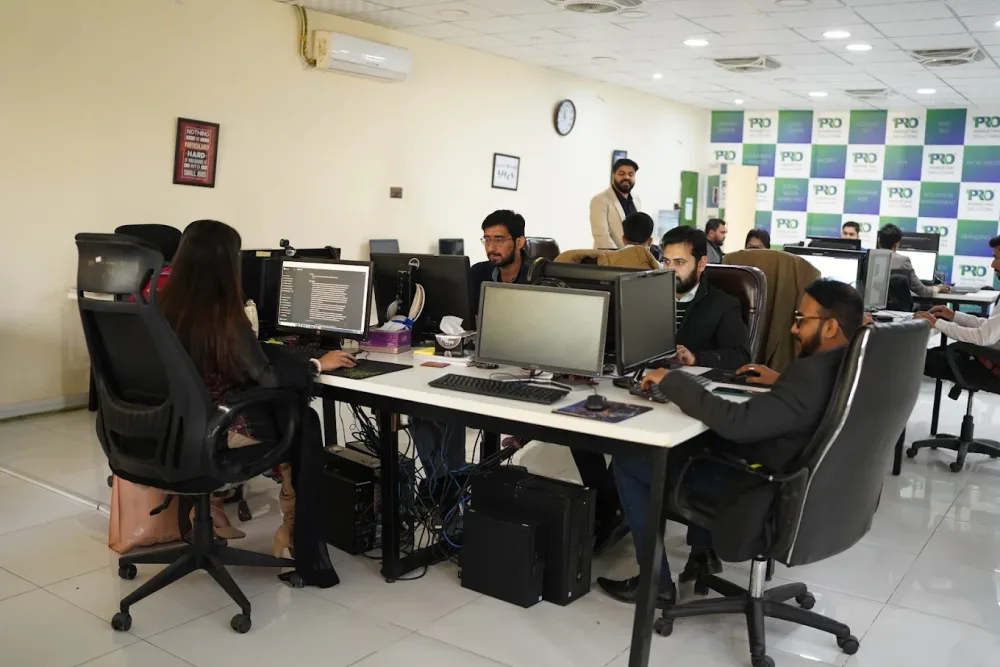 Watch our introduction
Published client experiences
Hear what working with WeProms was like, directly from our clients.
 Watch their story
Singapore · Events
 Watch their story
Client feedback
 Watch their story
New York · Wellness
Inside WeProms
Lahore, Pakistan
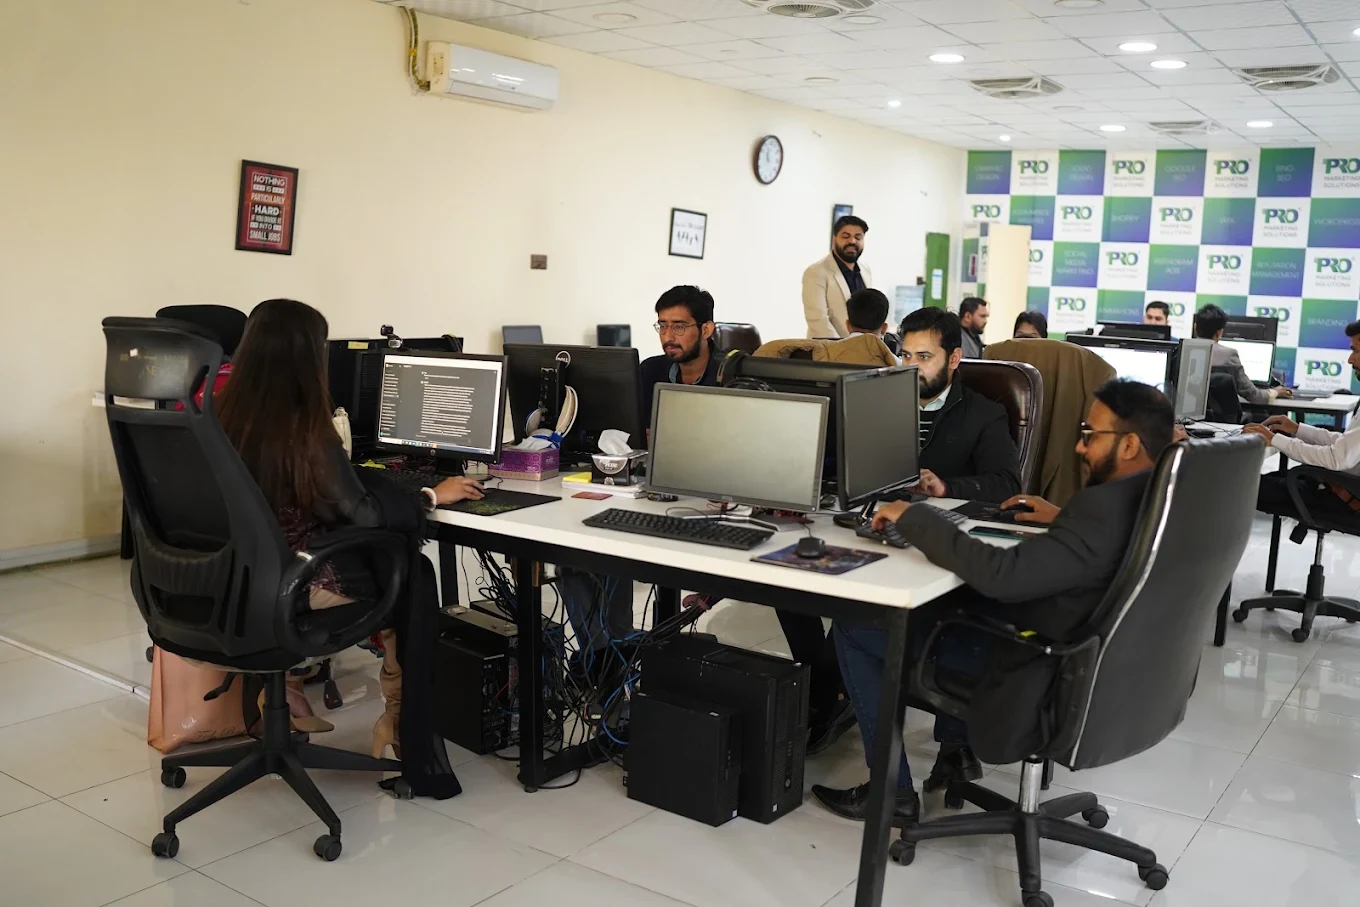

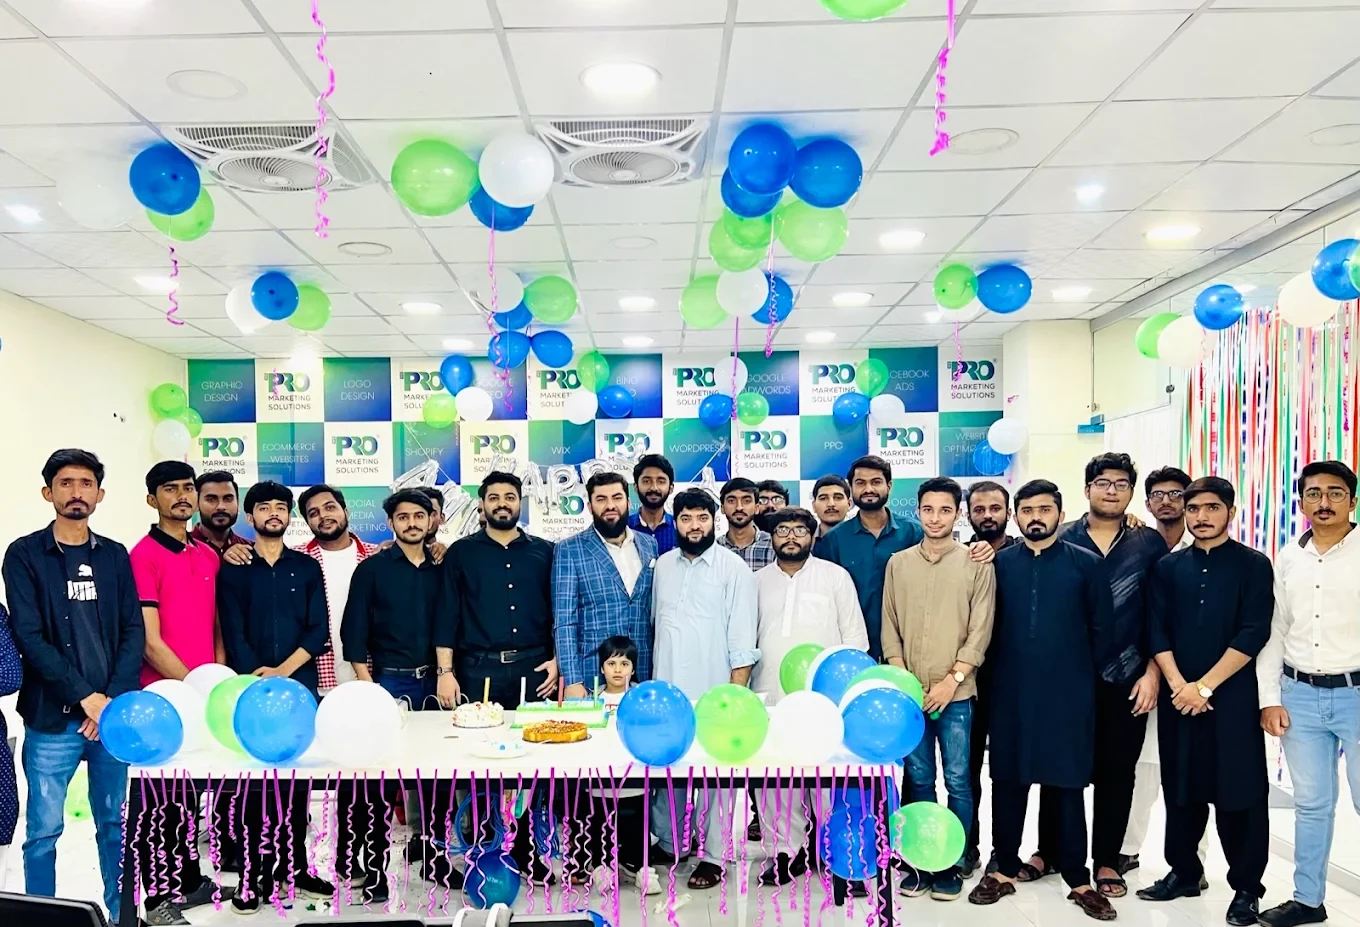

154, C1, Nespak Housing Scheme, Lahore 54770, Pakistan.
Working with a remote marketing team
You know your customers and market. Our strategists, creatives and technical specialists in Lahore help put the plan into practice. Agree the contact person, meeting times and approvals before we start.
Agree deliverables and the agency fee. Discuss ad spend and third-party tools separately.
Keep visibility and ownership. Agree access, asset licences and handover as part of the scope.
Agree a review schedule around your time zone. See what was delivered, what the numbers mean and what comes next.
Explore our Pakistan pricing guides for planning ranges and what shapes the cost. Your market, deliverables and existing setup determine the final quote; advertising spend and third-party costs are separate.
Discuss a quote for your market ↗Before the next step
A useful starting brief includes: event and tag inventory; examples of reporting disagreements; order or enquiry source records. We can agree appropriate access after the first conversation.
Review data quality against a business source of truth. Document missing coverage, consent and attribution differences.
We can discuss a one-off implementation, an ongoing scope or an initial build followed by support. The proposal states what is included, dependencies and the review points.
Agency work, media spend and third-party costs are identified separately. Your market, existing setup and delivery requirements determine the final scope and quote.
Share your website, target country and the next thing you want to improve. We’ll help you find a useful place to start.