
Reporting questions and definitions
Agree the users, decisions, metric meanings and review frequency.
Marketing dashboards built around the questions your team needs answered. Bring the relevant advertising, analytics and CRM data into a view with clear definitions and visible limitations.
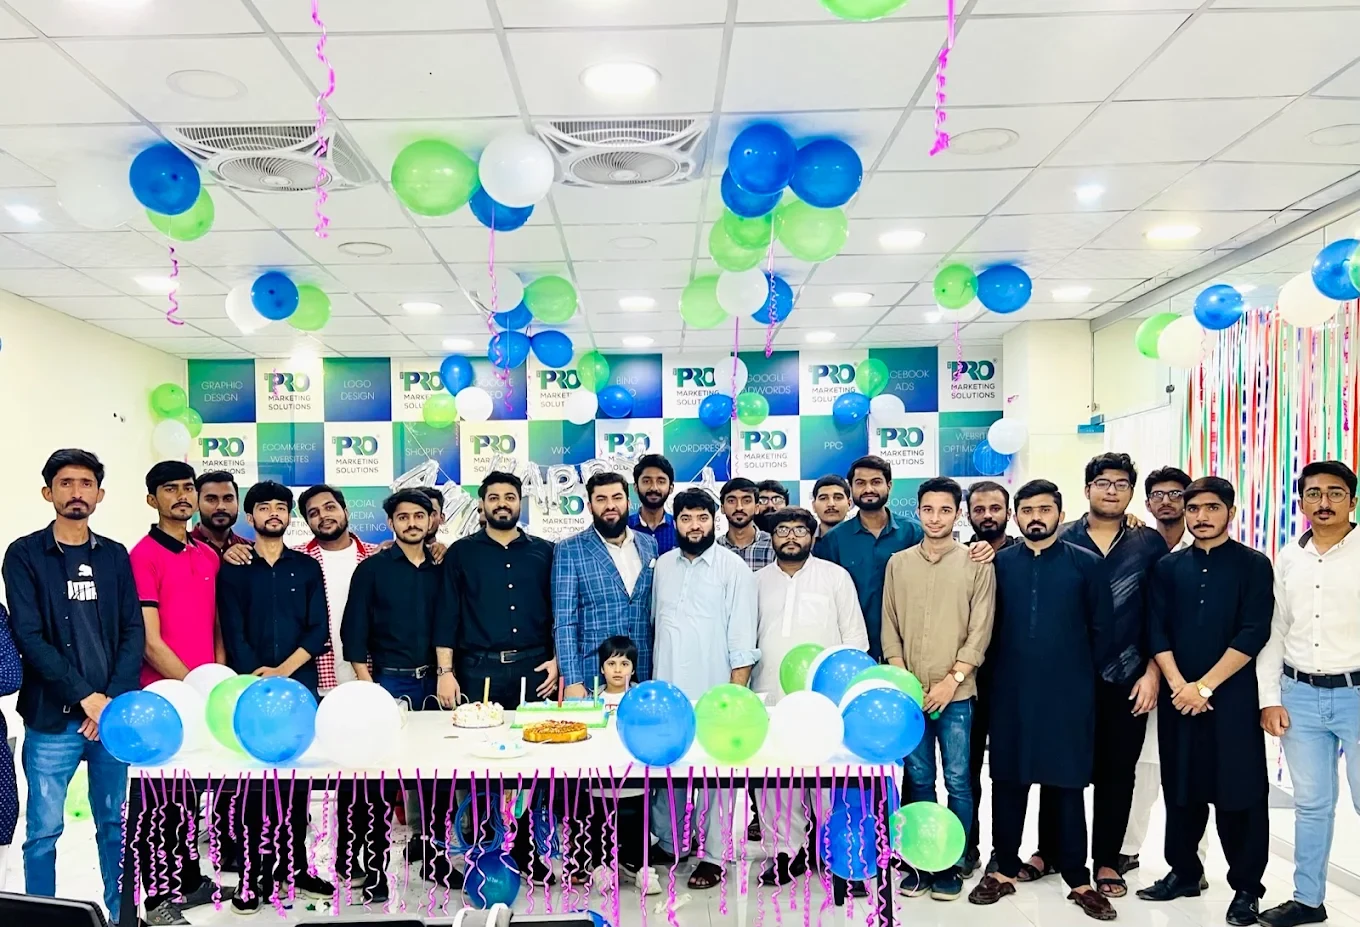
Get to know your team firstSee where the work happens and get to know WeProms before your first conversation. Our team is based in Lahore, working with business owners abroad and at home.
Get to know WeProms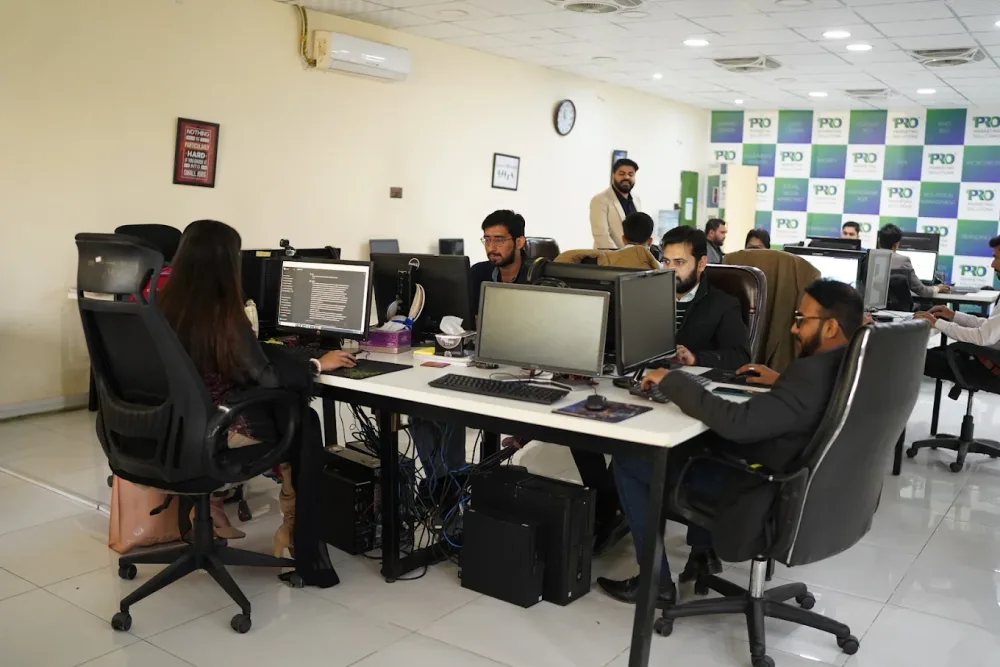 Watch our introduction
 A few of the brands we’ve worked with.








A useful dashboard changes emphasis with the reader. Explore the questions an owner, a marketing team and a sales team may need answered.
Definitions · Source context · Refresh timing
Owner
Bring agreed spend and outcomes into a view that makes definitions and gaps clear.
Keep reporting currencies, periods and definitions explicit.
Illustrative planning example. We agree the final setup around your business.
Definitions · Source context · Refresh timing
Marketing
Compare relevant channels and journeys without pretending that every platform counts an outcome in the same way.
Reconcile representative figures with their source before using the comparison.
Illustrative planning example. We agree the final setup around your business.
Definitions · Source context · Refresh timing
Sales
Give stage definitions, ownership and stalled tasks a useful place in the reporting conversation.
Document refresh timing and the owner of each connector.
Illustrative planning example. We agree the final setup around your business.
Marketing reporting dashboards / The practical scope
Agree the users, decisions, metric meanings and review frequency.
Review access, source fields and the appropriate connections for the chosen reporting tool.
Organise the agreed views around useful comparisons, time periods and business context.
Reconcile sample figures, explain refresh behaviour and document connector and report ownership.
Connector subscriptions and data warehouse work may add costs. A dashboard cannot repair missing source data by itself; measurement fixes are scoped where needed.
Published client experiences
Hear what working with WeProms was like, directly from our clients.
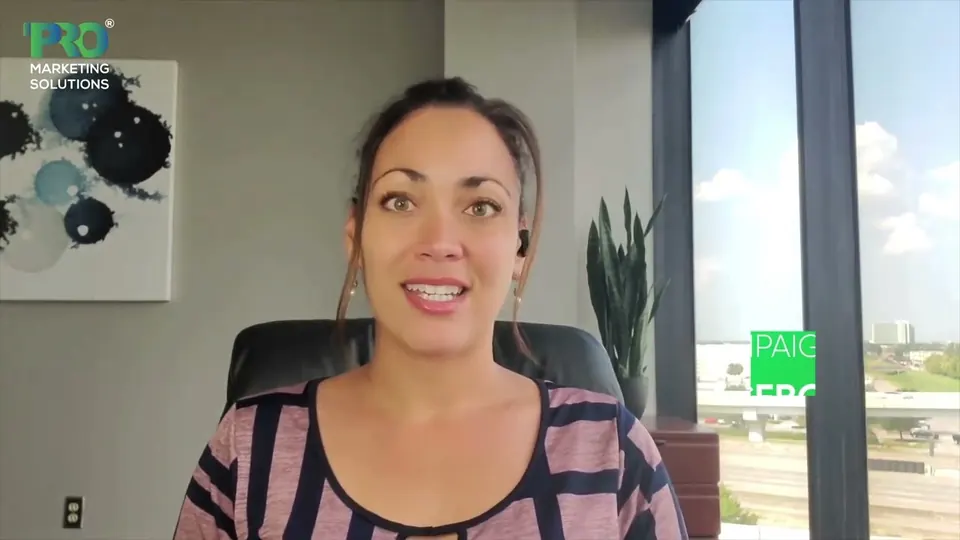 Watch their story
 Their business journey
 Watch their story
 Client feedback
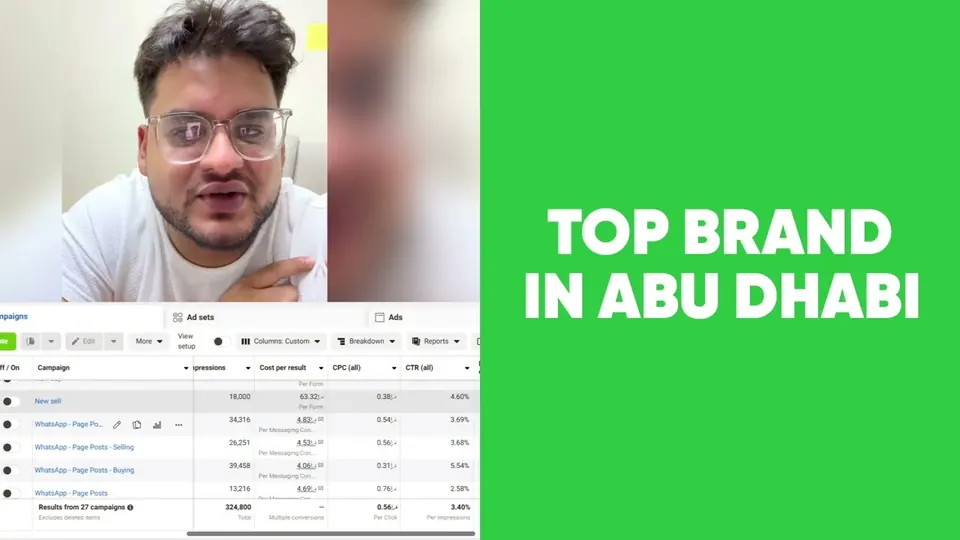 Watch their story
 Working with WeProms
A report should help someone choose an action. We begin with the audience and questions, reconcile the source definitions and design a view that keeps activity, enquiries and business outcomes understandable.
Does this sound familiar?
Questions worth reviewing
Can users explain what each important metric includes?
Is the refresh timing and any connector failure visible?
Can the team identify an appropriate action from the report?
Gather the business questions and the people who will use the report.
Map definitions, time zones, currencies and available fields.
Create the agreed views and compare representative numbers with their sources.
Document how to read, refresh and maintain the report.
Service guide
The approach, practical steps and decisions behind the plan.
Marketing analytics dashboard setup is the process of creating unified, real-time reporting interfaces that combine data from advertising platforms, analytics tools, CRM systems, and other business data sources into single views for decision-making. For businesses in Pakistan managing multiple marketing channels, properly designed dashboards typically save 5-10 hours per week in manual reporting while enabling faster, more informed marketing decisions.
This service is essential for businesses that need clear visibility into marketing performance without spending hours each week compiling data from multiple platforms. WeProms Digital provides comprehensive marketing analytics dashboard setup services using Looker Studio, Power BI, and other platforms, transforming fragmented data into actionable insights that drive growth.
Marketing analytics dashboards are visual interfaces that aggregate, display, and sometimes analyze data from multiple marketing and business systems. Unlike individual platform reports that show data in isolation, dashboards combine data from Google Ads, Meta Ads, GA4, CRM systems, email platforms, and other sources into unified views.
The key benefit is eliminating data silos. Without a unified dashboard, understanding marketing performance requires logging into 5-10 different platforms, exporting data, and manually combining it in spreadsheets. This process is time-consuming, error-prone, and produces stale data by the time analysis is complete.
Marketing dashboards matter because they enable faster, more confident decision-making. When you can see your Google Ads spend alongside your Meta Ads spend alongside your GA4 conversions alongside your CRM closed deals, you can quickly identify optimization opportunities that would be invisible when viewing each platform in isolation.
The financial impact is substantial. Studies show that marketing teams spend an average of 15-20% of their time on reporting activities. Unified dashboards can reduce this to 5-10%, freeing up significant time for strategic work. More importantly, real-time dashboards enable faster response to performance changes, preventing wasted spend on underperforming campaigns.
Marketing analytics dashboards work by connecting to data sources through APIs and connectors, transforming and combining data, and visualizing results in interactive formats.
The foundation is data source connection. Modern dashboard platforms like Looker Studio (formerly Data Studio) offer native connectors to popular platforms including Google Analytics, Google Ads, Meta Ads, and Google Sheets. For platforms without native connectors, third-party connectors or custom API integrations can pull data into the dashboard.
Data transformation processes clean, combine, and calculate metrics from raw data. This includes joining data from different sources (such as matching ad spend data to conversion data), calculating derived metrics (such as cost per acquisition or ROAS), and filtering data to show relevant time periods or segments.
Visualization design presents data in formats optimized for quick comprehension. This includes scorecards showing key metrics, time-series charts showing trends over time, comparison views showing performance across channels or campaigns, and detailed tables for drill-down analysis.
Interactivity enables users to filter, segment, and explore data. Date range controls allow viewing different time periods. Channel filters enable focusing on specific marketing channels. Segmentation options allow breaking down data by audience, geography, device, or other dimensions.
Pakistani businesses face specific challenges that make marketing dashboards particularly valuable. The typical Pakistani business using digital marketing works with at least 5-10 different platforms: Google Ads, Meta Ads, TikTok Ads (increasingly popular in Pakistan), GA4, a CRM system, email marketing platform, and potentially others.
Managing data from these platforms through individual interfaces is impractical. Marketing managers and business owners cannot efficiently monitor performance across 10 platforms daily. Critical issues often go unnoticed for days or weeks because no one is checking the right platform at the right time.
The competitive landscape in Pakistan’s major cities (Lahore, Karachi, Islamabad) makes marketing agility important. Businesses that can quickly identify and respond to performance changes outperform those relying on weekly or monthly reporting cycles.
Time constraints are particularly acute for Pakistani SMEs where marketing managers often handle multiple responsibilities. Dashboards that reduce reporting time from hours to minutes free up valuable time for strategy and optimization.
The most fundamental problem dashboards solve is data fragmentation. Without unified dashboards, performance data exists in isolated platform silos. Google Ads shows one view of conversions, Meta shows another, and your CRM shows yet another. Reconciling these views requires manual data collection and manipulation that consumes hours each week.
When performance data requires manual compilation, decisions are made on stale data. By the time a weekly report is compiled, days have passed since the data was current. Real-time dashboards enable decisions based on current data, allowing faster response to both opportunities and problems.
Different platforms define metrics differently. A “conversion” in Google Ads might include leads, while a “conversion” in GA4 might only include purchases. Without standardized definitions in a unified dashboard, cross-platform comparison is misleading. Dashboard setup includes defining consistent metric calculations across all data sources.
Business owners and executives need clear, high-level views of marketing performance. Individual platform reports are too detailed and require platform-specific knowledge to interpret. Executive dashboards provide simplified views that communicate marketing performance to non-specialists.
Marketing teams often spend significant time each week or month compiling reports for stakeholders. This repetitive, low-value work consumes time that could be spent on optimization and strategy. Automated dashboards eliminate manual report compilation while providing more current data.
We begin by understanding your reporting needs and defining key performance indicators. This includes identifying all stakeholders and their reporting requirements, defining core KPIs that matter for your business, mapping all data sources that need to be included, and establishing metric definitions and calculation methodologies.
We audit existing data sources and establish connections. This includes reviewing data quality and completeness in each platform, configuring native data connectors where available, implementing third-party connectors for platforms without native support, and setting up any required data pipelines or ETL processes.
We design the data model that will power your dashboards. This includes defining data relationships between sources, creating calculated fields for derived metrics, establishing filtering and segmentation logic, and designing data refresh schedules to ensure current data.
We design and build dashboards tailored to each audience. This includes creating executive summary dashboards with high-level KPIs, building channel-specific dashboards for tactical management, designing comparison dashboards for cross-channel analysis, and implementing interactive filters and controls for data exploration.
We validate dashboard accuracy before deployment. This includes verifying data accuracy against source platforms, testing calculated metrics against expected values, validating filters and controls function correctly, and ensuring dashboards load and perform acceptably.
We train your team on using and maintaining dashboards. This includes training sessions for different user groups, documentation on dashboard features and metrics, establishing processes for ongoing dashboard maintenance, and creating protocols for requesting dashboard modifications.
WeProms Digital offers comprehensive marketing analytics dashboard services for businesses in Lahore, Karachi, Islamabad, and throughout Pakistan. Our services include:
Looker Studio Dashboard Development: We build custom dashboards in Google Looker Studio, leveraging its native connectors to Google platforms and third-party connectors for other data sources.
Power BI Dashboard Development: For businesses requiring advanced analytics or on-premise data integration, we develop dashboards in Microsoft Power BI.
Multi-Platform Data Integration: We connect data from advertising platforms (Google, Meta, TikTok, LinkedIn), analytics platforms (GA4, Mixpanel), CRM systems (HubSpot, Salesforce, Pipedrive), email platforms, and other business systems.
Executive Dashboard Design: We create high-level dashboards designed for business owners and executives, focusing on key metrics and clear visual communication.
Channel Performance Dashboards: We build detailed dashboards for each marketing channel, enabling tactical management and optimization.
Cross-Channel Attribution Dashboards: We design dashboards that visualize attribution data, showing how channels work together to drive conversions.
Real-Time Performance Monitoring: We configure dashboards with real-time or near-real-time data updates, enabling rapid response to performance changes.
Automated Reporting: We set up automated report delivery via email, ensuring stakeholders receive regular updates without manual intervention.
Dashboard Maintenance and Updates: We provide ongoing support for dashboard maintenance, including connector updates, metric adjustments, and new report development.
Dashboard investment varies based on complexity, data sources, and the number of dashboards required. A basic executive dashboard with 2-3 data sources typically requires 1-2 weeks. Comprehensive multi-dashboard implementations with 10+ data sources typically require 3-4 weeks.
The ROI of dashboard investment comes from multiple sources. Time savings from eliminated manual reporting typically save 5-10 hours per week for marketing teams. Faster decision-making from real-time data improves marketing efficiency. Executive visibility improves alignment between marketing and business strategy.
For a Pakistani business with a marketing team of 3 people spending 5 hours weekly on reporting, dashboards that reduce this by 70% save 10.5 hours weekly. At typical marketing salaries, this represents substantial value in recovered productive time.
WeProms Digital provides marketing analytics dashboard services to businesses across Pakistan, including Lahore, Karachi, Islamabad, Rawalpindi, Faisalabad, Multan, Peshawar, Quetta, and remote teams nationwide. We offer both on-site consultations (in major cities) and fully remote implementation support.
Our implementation timelines typically range from 2-4 weeks for comprehensive dashboard implementations, with ongoing support available for maintenance and updates. We work as an embedded partner with your existing marketing, analytics, and leadership teams to ensure dashboards meet real business needs and drive decision-making.
From Lahore, across borders
We work with clients in the UK, UAE, Singapore, Germany, Canada and Australia. Wherever your business takes you, our team in Lahore helps move your marketing forward.
Hear from our clients United Kingdom
 United Arab Emirates
 Singapore
 Germany
 Canada
 Australia
We also welcome enquiries from Pakistani business owners in:
Inside WeProms
Lahore, Pakistan
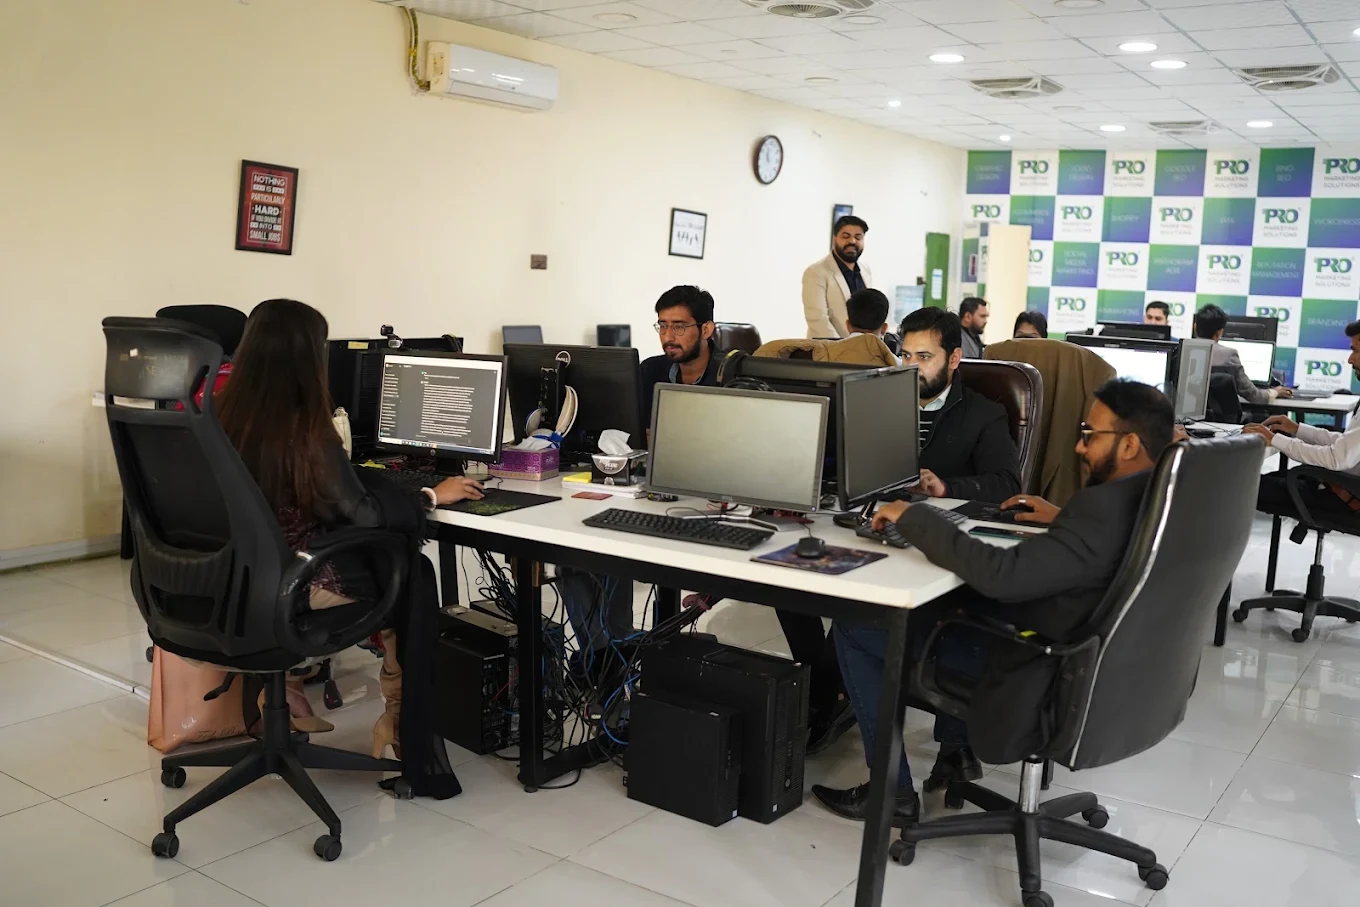


154, C1, Nespak Housing Scheme, Lahore 54770, Pakistan.
Working with a remote marketing team
You know your customers and market. Our strategists, creatives and technical specialists in Lahore help put the plan into practice. Agree the contact person, meeting times and approvals before we start.
Agree deliverables and the agency fee. Discuss ad spend and third-party tools separately.
Keep visibility and ownership. Agree access, asset licences and handover as part of the scope.
Agree a review schedule around your time zone. See what was delivered, what the numbers mean and what comes next.
Marketing reporting dashboards
Straight answers to help you shape the brief.
More about working with WePromsWe review the sources, access requirements and team needs before agreeing the reporting platform and available connectors.
Refresh behaviour depends on the source, connector and platform. We document the expected timing rather than presenting every view as live.
Where suitable identifiers and permissions are available, we can connect agreed sources. We document gaps and avoid implying a complete customer history where one does not exist.
Share the business, the market and the part you want to improve. We’ll help shape the next step.
Start a conversation